5 minute read / Jan 2, 2017 /
Benchmarking AppDynamics S-1 - How 7 Key SaaS Metrics Stack Up
Founded in 2008, AppDynamics is a leader in the application performance management space. AppDynamics technology helps engineers determine how software applications behave as users interact with them. Based in San Francisco, AppDynamics employs about 1200 people and has raised approximately $315M to date. The company filed their S-1 recently to take the company public. Let’s look at some of the key metrics and then compare AppDynamics to NewRelic, a close competitor which went public in late 2014.
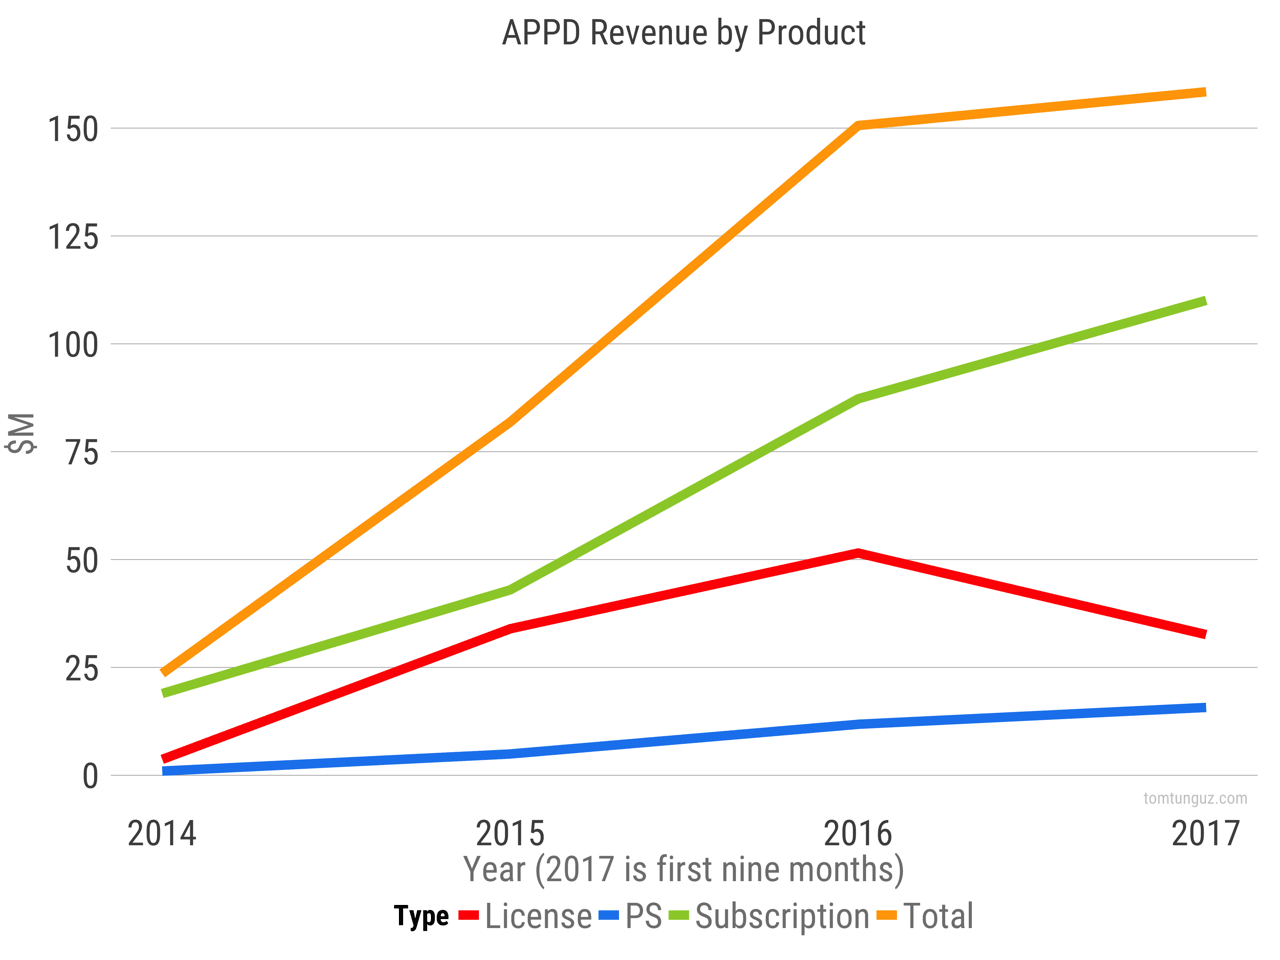
AppDynamics generates revenue three ways. They sell their APM software as a perpetual software license in addition to a subscription (SaaS). Also, they offer professional services to their clients. The company provided full year data through 2016. For 17, the S-1 contains the first nine months of data, so it shows a decline.
AppD has grown from $18.9M to $42.9M to $87.3M in revenue through 2016. The SaaS product has always generated more revenue than license, but the two revenue items did contribute similar revenues in 2015, at which point the company seems to have decided to focus actively on selling SaaS.
A key element of SaaS growth is AppD’s ability to command larger contract values: The increase in subscription revenue was primarily due to a 20% increase in active customers, and an increase in average subscription revenue recognized per active customer of 51% to approximately $56,000 in the nine months ended October 31, 2016, as compared to approximately $37,000 in the nine months ended October 31, 2015.
License software is going in the other direction: License revenue in the nine months ended October 31, 2016 decreased by $2.2 million, or 6%, compared to the nine months ended October 31, 2015, primarily due to a 30% decrease in the average transaction size, partially offset by a 35% increase in the number of perpetual license transactions.
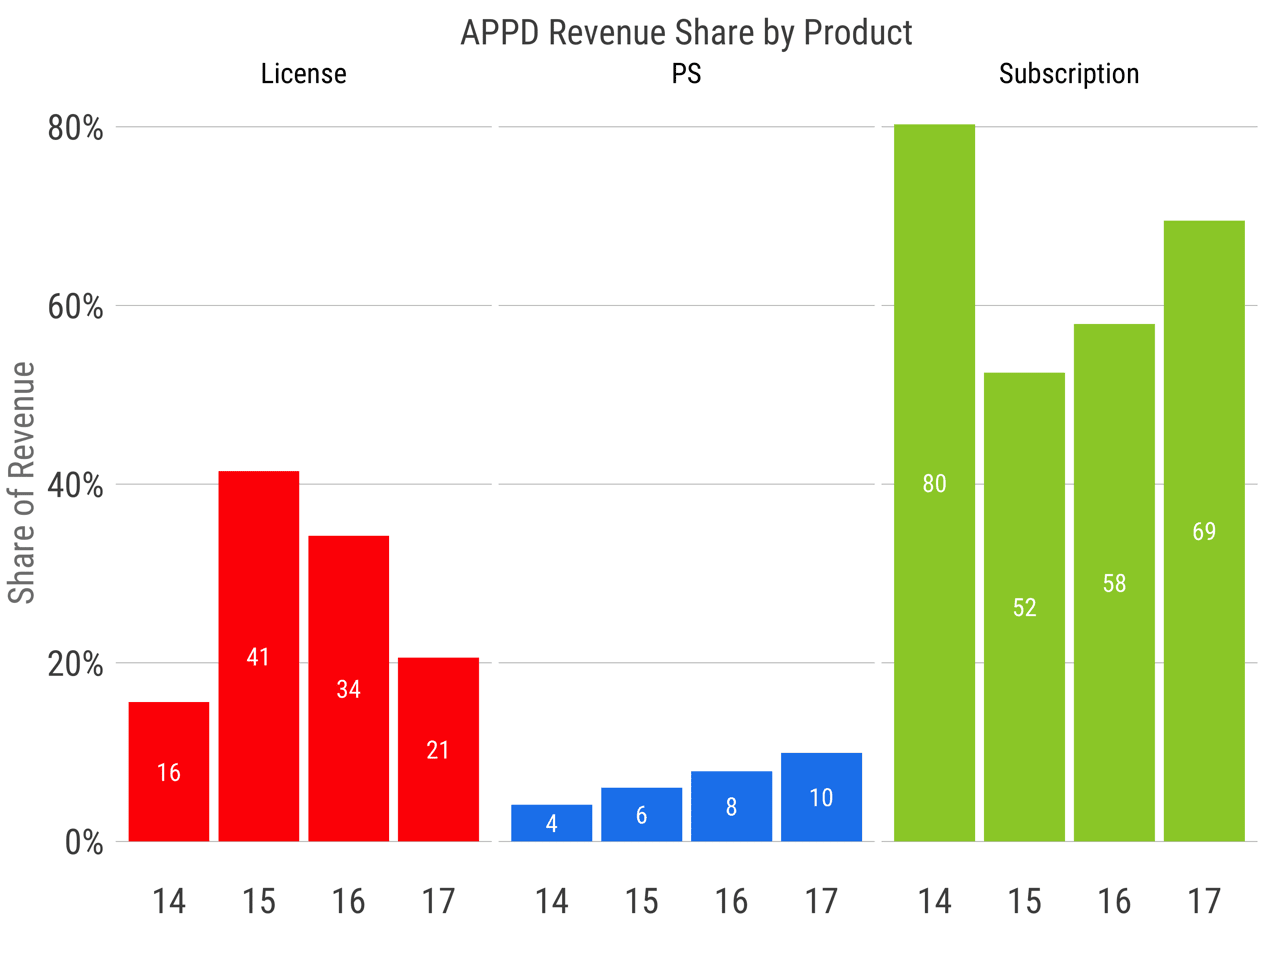
This chart shows the revenue contribution of each product line in percentage terms. There are three interesting trends. First, Subscription generated 80% of the revenue in 2014. AppDynamics subscription revenue has three parts: time-bound licenses (42% of last 9 months’ revenue), SaaS (38.6% of revenue), and maintenance (19.8% of revenue).
Second, license revenue jumped in 2015 to 41% of revenue and has fallen every year since. AppDynamics has typically sold in the upper-mid-market and enterprise markets, where licensing software remains common. But over time, the data indicates the company has had more success with SaaS and/or deliberately shifted to SaaS.
Third, professional services revenue is growing as a share of revenue. This could be because AppDynamics is serving larger customers who are willing to pay for greater services, customization and training, or because the ongoing support at customers as they growth the product is increasing with time.
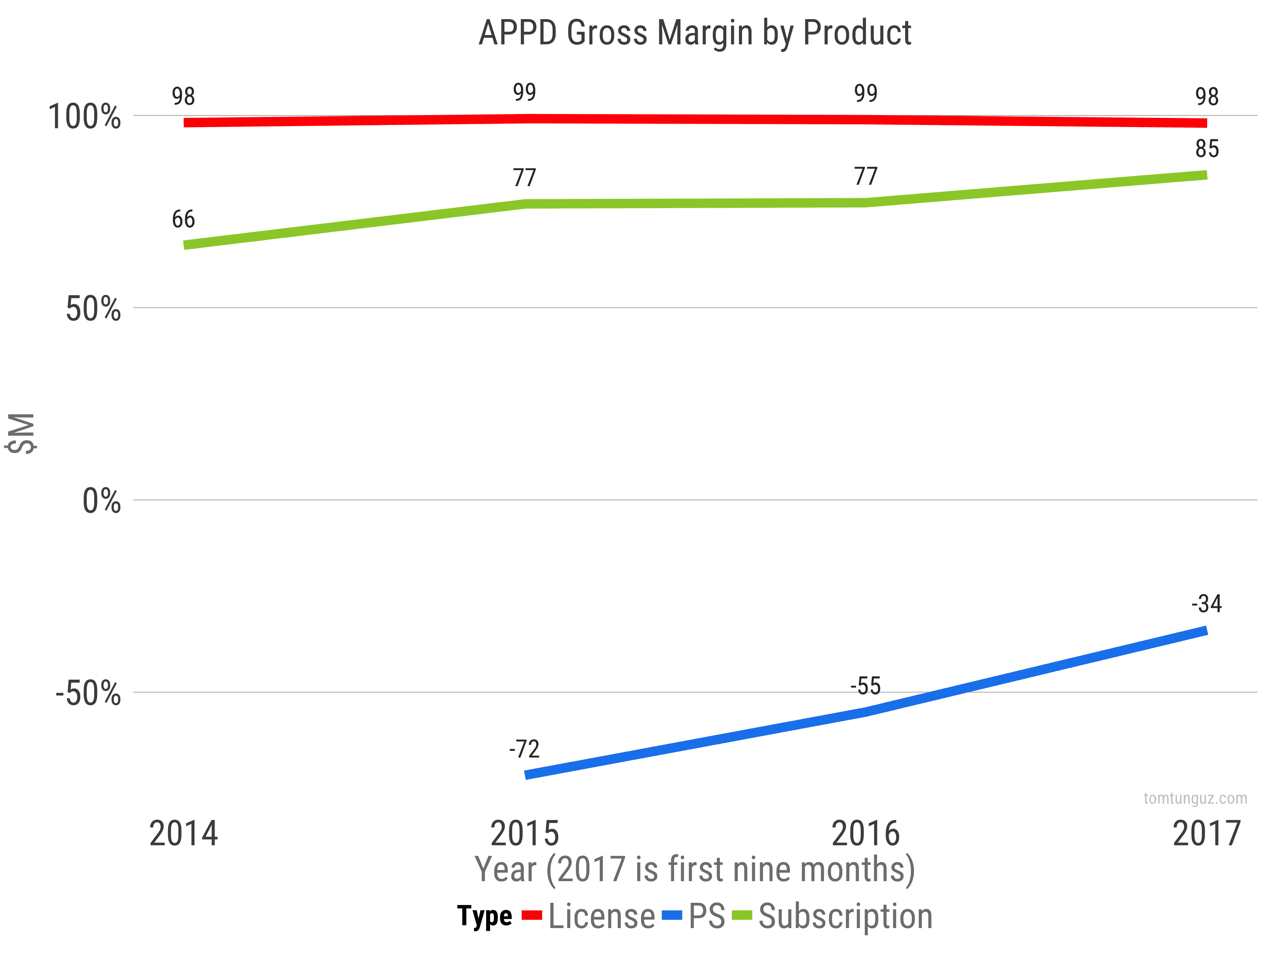
The gross margins are excellent. License revenue doesn’t bear the cost of sales SaaS products do (servers and bandwidth). So the margins are nearly 100%. The SaaS margins are terrific at greater than 77%, which is much higher than the publicly traded median of 71%. 2017 GM seems to be much improved year-to-date at 85%. Professional services margin has improved steadily, and is now at -34% meaning one dollar of PS revenue costs $1.34 to provide. This PS margin falls in line between Hortonworks and Marketo at the lower end of the spectrum.
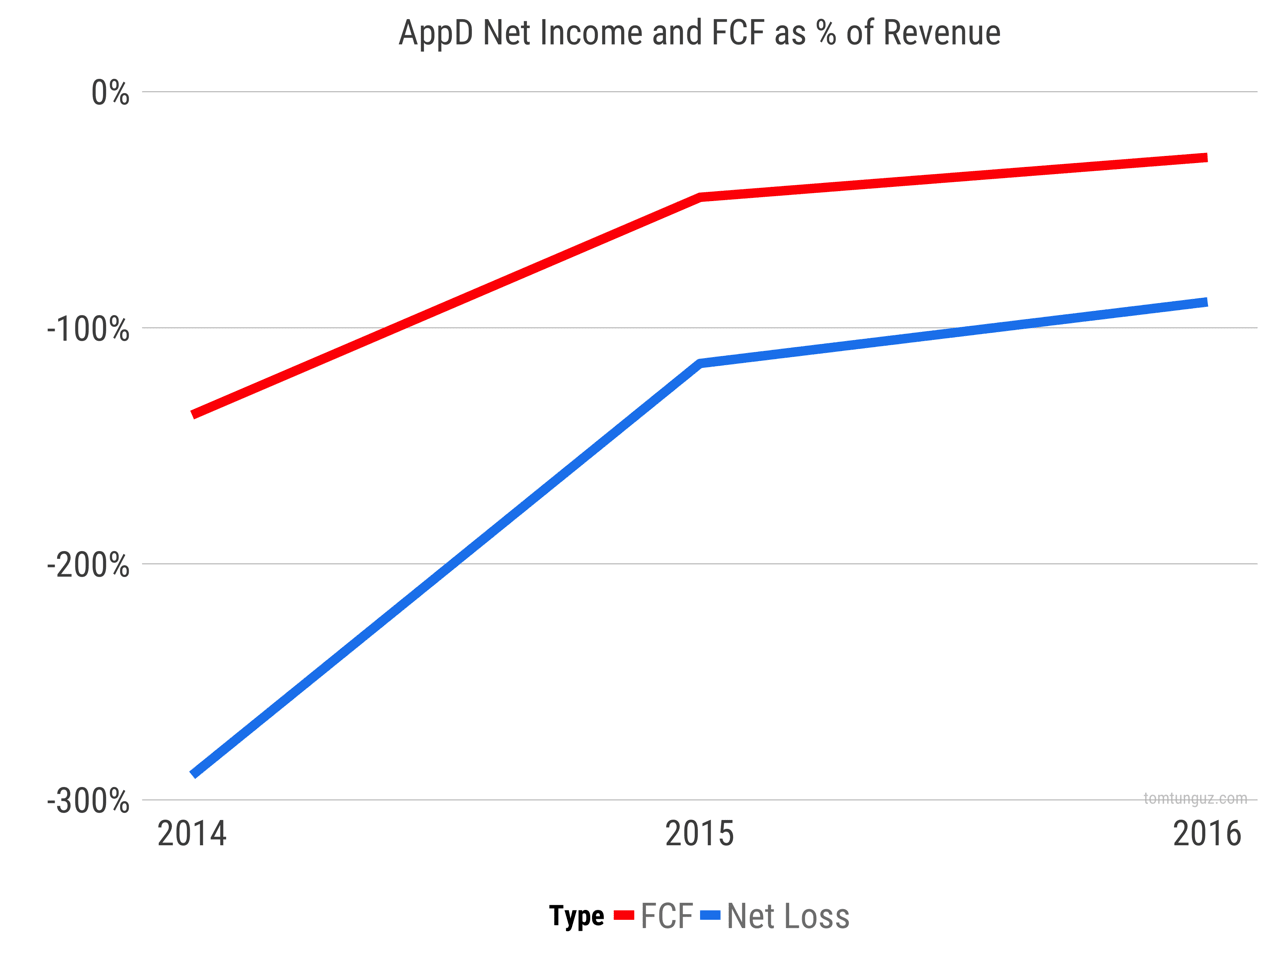
Let’s look at profitability and cash flow. AppDynamics burned $41.3M in cash in 2016 on $150M in revenue, or about 28% of revenue. The business is closing the gap to cash-flow-break-even. There’s a similar story about profitability, with a loss of $134M in revenues. According to a 2015 analysis, most SaaS companies attain a -10% net income margin and a 0% cash flow margin right around year six. AppDynamics may take some more time to get there, but it’s on the right path.
| Company | ARPC at IPO |
|---|---|
| APPD | 76,000 |
| NEWR | 6,000 |
Let’s compare AppDynamics to New Relic. One of the most important differences between the two is go-to-market strategy. New Relic pursues a bottoms-up strategy, targeting developers and smaller accounts. AppDynamics employed a top-down strategy. This difference is reflected in the greater than 10x difference in the average revenue per customer at IPO between the two companies.
Another important difference is the nature of the revenue. The majority of AppDynamics software revenue is license, both perpetual and timed, whereas New Relic’s revenue is predominantly SaaS.
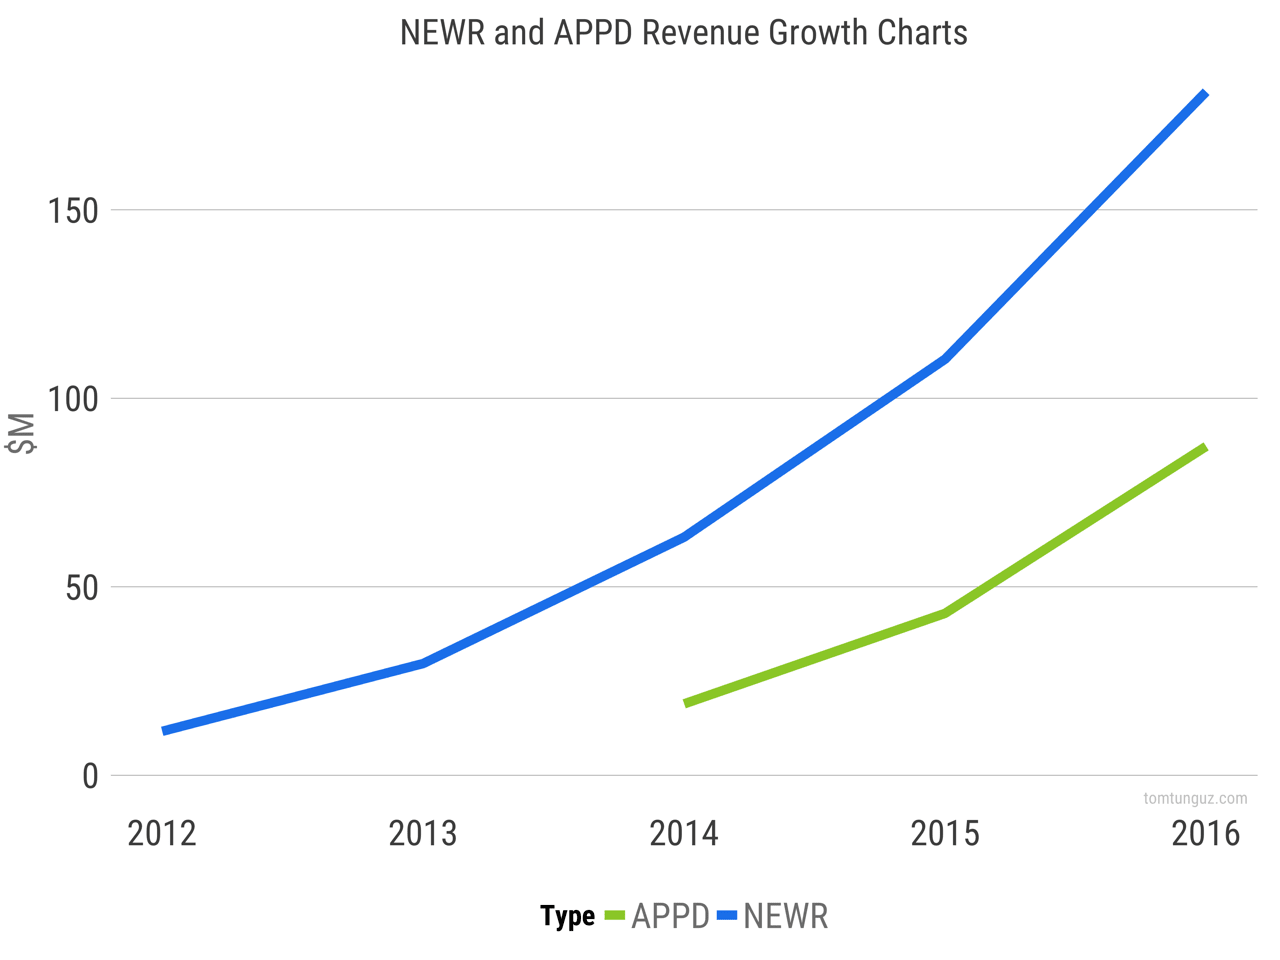
We can see that the two companies have very similar revenue curves, although AppDynamics is offset by one year. It was also founded about a year later.
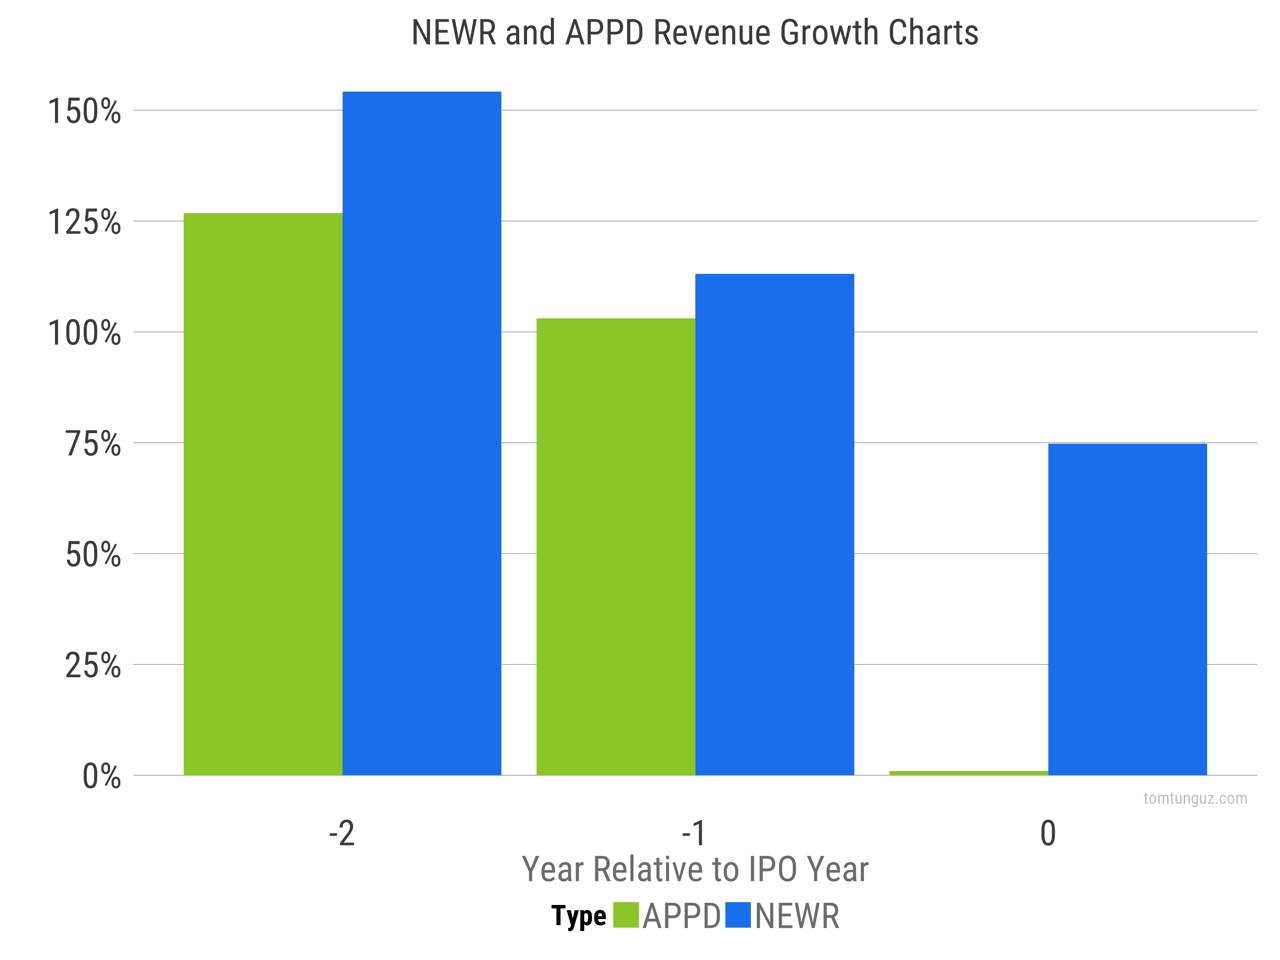
The growth rates of the businesses as they approach IPO are quite similar. And the account expansion figure are 123% (AppD) vs 124% (NewR), statistically identical.
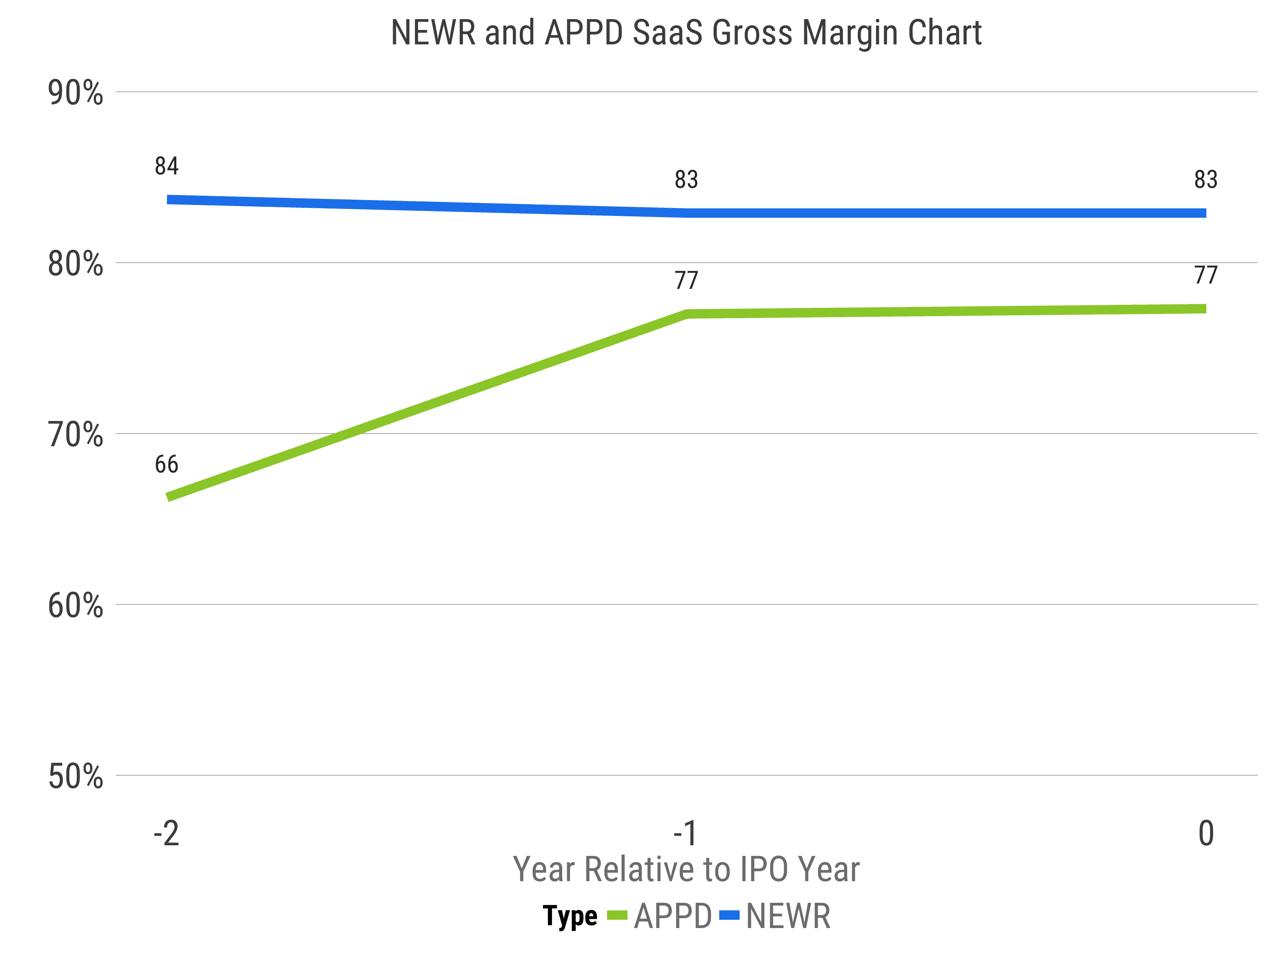
The subscription gross margins of the two businesses are very similar. New Relic’s is about five percentage points higher. Note, I’m only taking into account AppD’s SaaS revenue line.
In summary, these two companies have approached the same market from different angles and though there are some differences like license revenue vs pure subscription and markedly variant ARPCs; the core businesses of each are quite similar in margin profile. Some may point to the fact that New Relic raised about $100M less before IPO than AppDynamics, but looking at the balance sheets, it’s a wash. New Relic had $20M in the year of the IPO and AppD will have $120M.
This analysis serves as a great reminder that there are many ways to build exceptional SaaS companies. In this case, both bottoms up and top down were successful paths to becoming dominant players in the application performance management space.