2 minute read / May 3, 2017 /
When Statistics Will Mislead You
Earlier this week, a founder asked whether the fundraising market suffered from seasonality. Are there more prosperous months to raise than others? That’s a simple question to answer - or so I thought. Ultimately, a dinosaur proved to me the answer is more nuanced.
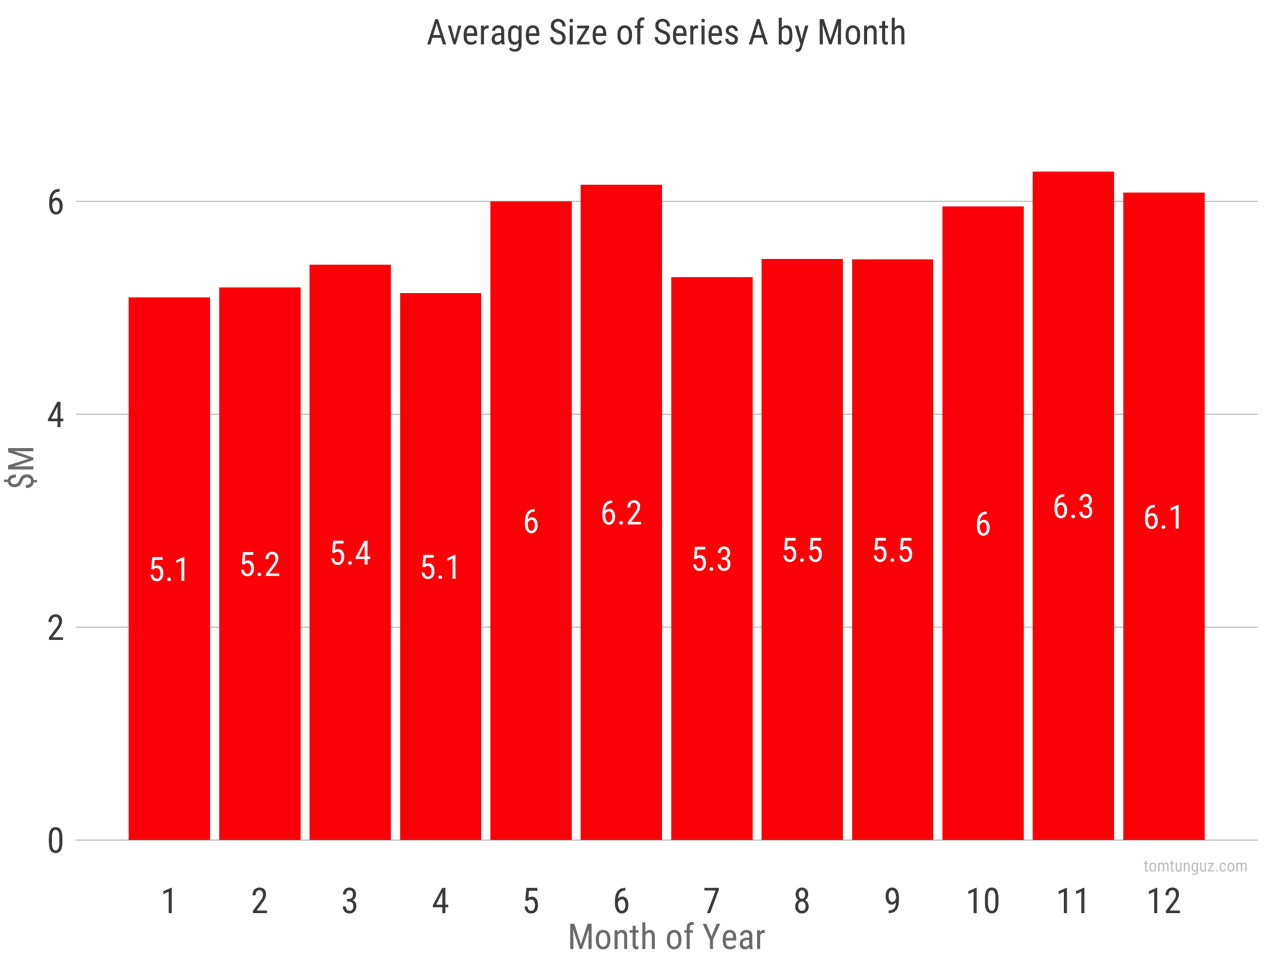
I plotted the mean round size of Series As from 2010-2016 in the bar chart above. You’ll notice, as I did, a spike in June and November. And a t-test shows these differences are statistically significant. The p-values for Jan/June and Jan/November are 0.002 and 0.0008. A very compelling figure to argue the difference in means is real. What logic might explain these surges?
Perhaps venture capitalists aim to invest in 2 companies per year. Near the conclusion of every six month period, they clamor to meet that pace. Greater competition in June and November drives greater prices and larger round sizes.
Or perhaps in June, investors are willing to credit the company with executing their plan for the rest of the year and price the business based on next year’s milestones? Also in December?
I wondered if the same seasonality applies to Series Bs.
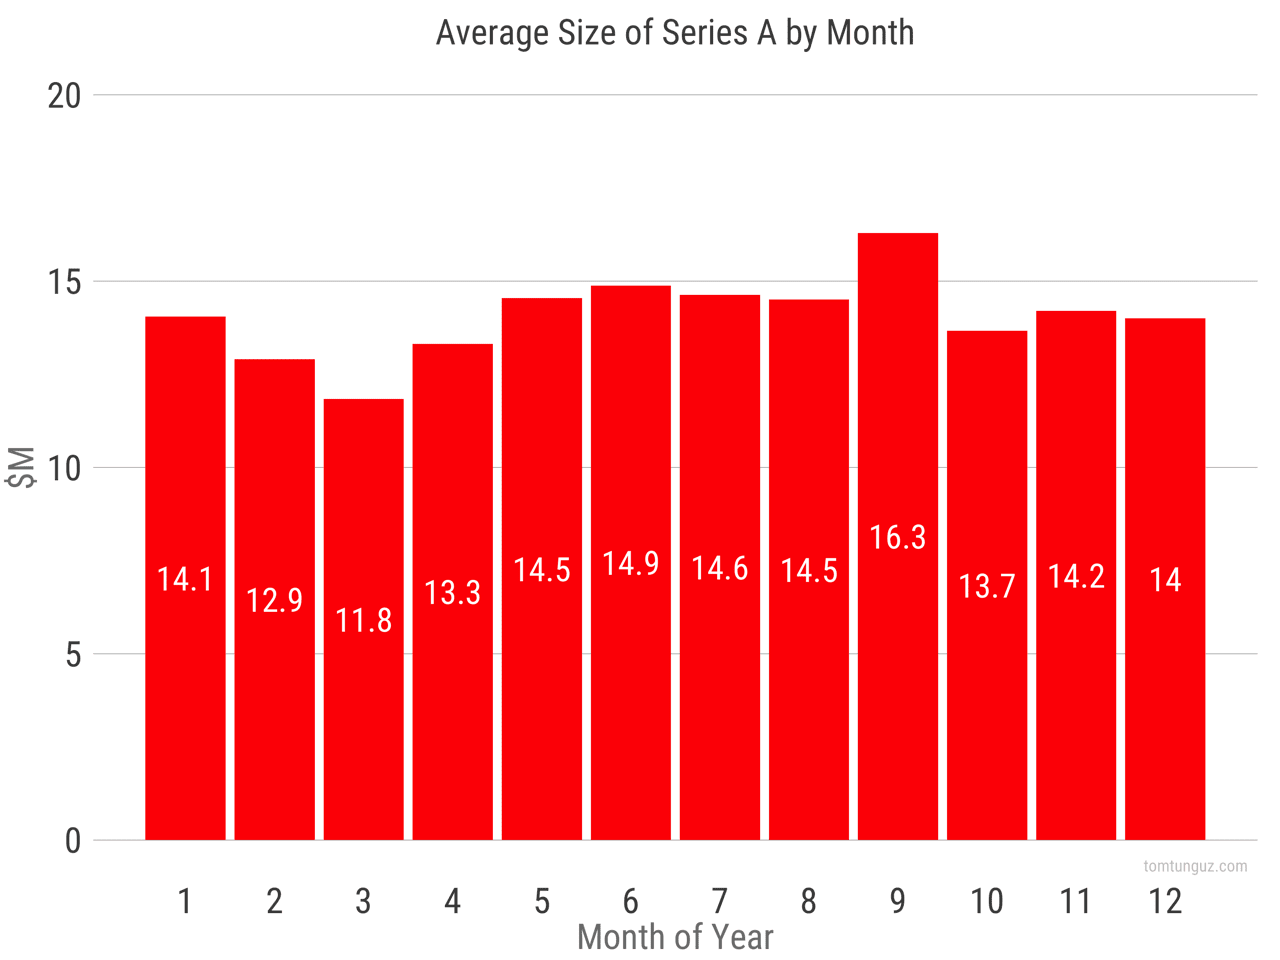
Series B investors operate on a different schedule. They seem to vie more stridently to invest in startups in September, and relax most in March. Again, the p values for highest/lowest are compelling: 0.0017. The patterns are real - aren’t they?
Let’s look at the data by year instead of aggregated across the six years.
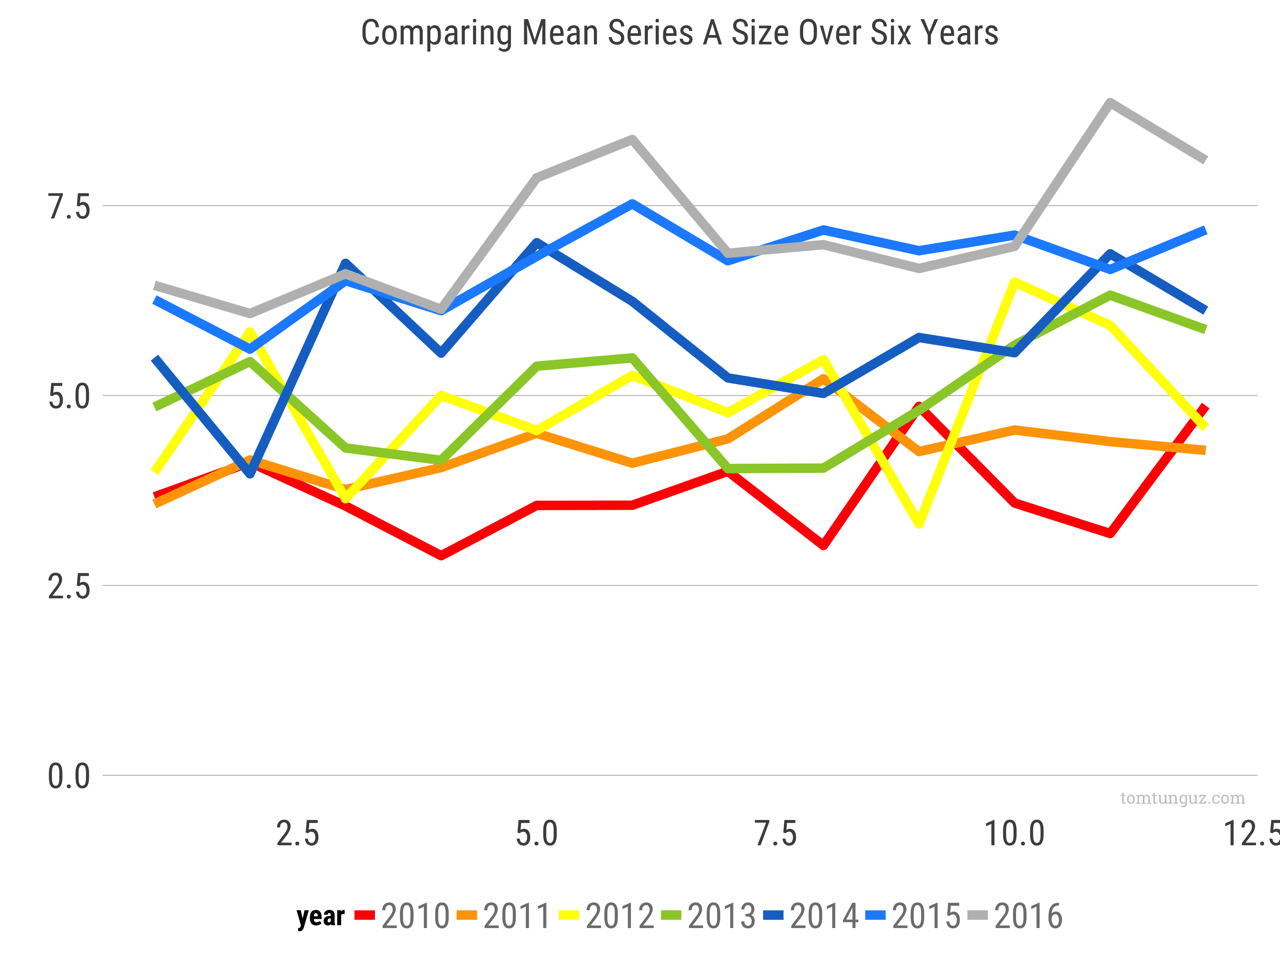
It’s chaotic. No clear pattern as far as I can see. Even if the statistics do claim a strong difference between round sizes by month.
This exercise reminded me of a post written by Autodesk research: Same Stats, Different Graphs.

In the graphic above, each of the different data sets depicted, the dinosaur, the star, the parallel lines, the ellipse, and so on, all generate the same summary statistics. The medians, means, standard deviations and even Pearson correlations equal each other to two decimal places.
My statistical goose chase reinforced for me that blindly looking at summary statistics and p-values without contemplating the underlying data is the best way to draw spurious conclusions. There is no pattern to investment seasonality in the startups. Don’t let the summary statistics fool you.