3 minute read / Jan 5, 2017 /
Which Round Will Be the Hardest to Raise in 2017?
The fundraising market is in flux. The data indicates that it is certainly reverting to the mean after two record years in 2014 and 2015. Late stage market dynamics are changing as hedge funds and mutual funds seek other areas to invest. In 2017, there will be a lot of comparison between the prices public bound companies fetch at IPO compared to the last round private valuations as the public window opens. Given all that change, which early round will be the hardest to raise for founders in 2017?
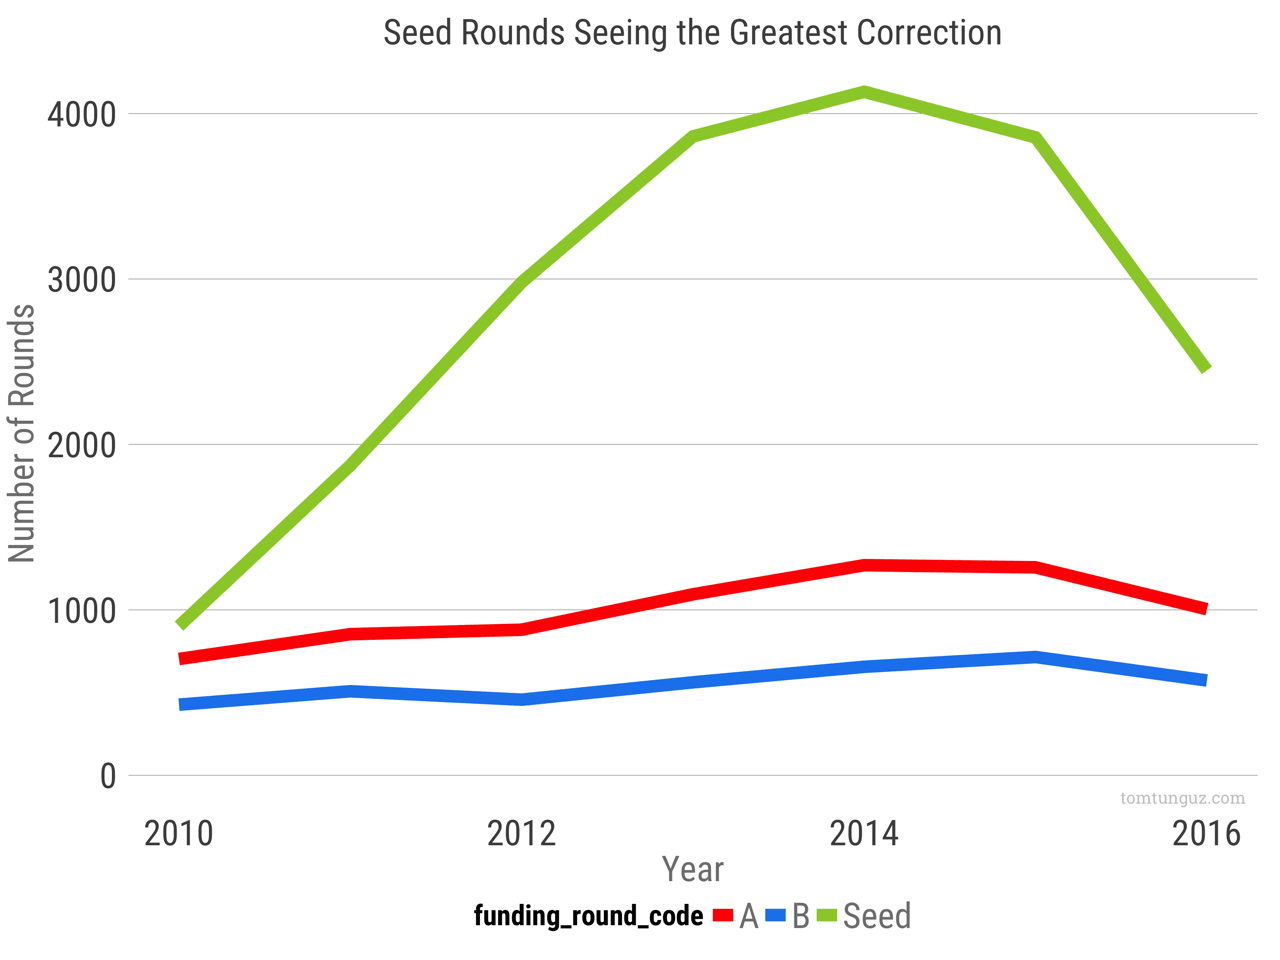
Let’s take a look at the Crunchbase data for US startups. Seed rounds have seen the greatest growth since 2010 from approximately 1000 rounds per year to more than 4000 rounds per year in 2014. In 2016, they also saw the greatest drop, 37%, to about 2500. Series As and Bs counts grew 40% from their 2010 figures before falling 20% in 2016. They follow the same pattern, but not nearly to the magnitude of seed rounds.
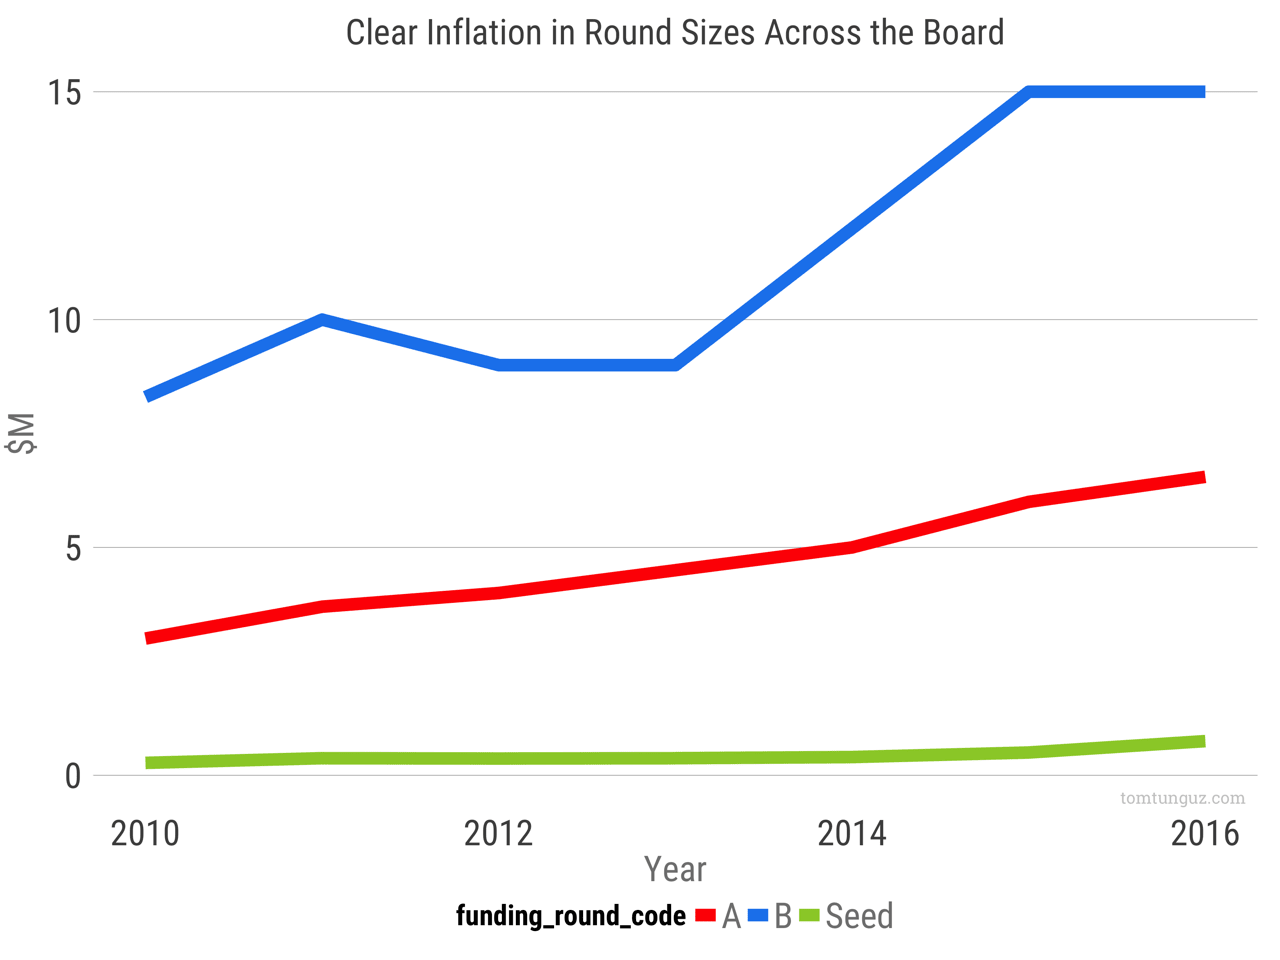
Median round sizes across the three different investment rounds all exhibit signs of inflation. Series Bs in particular have grown by 30% from $10M to $15M median. Series As have grown steadily from $3M to $6.6M, 17% annual growth. Seed medians have tripled from $272k to $750k, the fastest of all, at 25% per year.
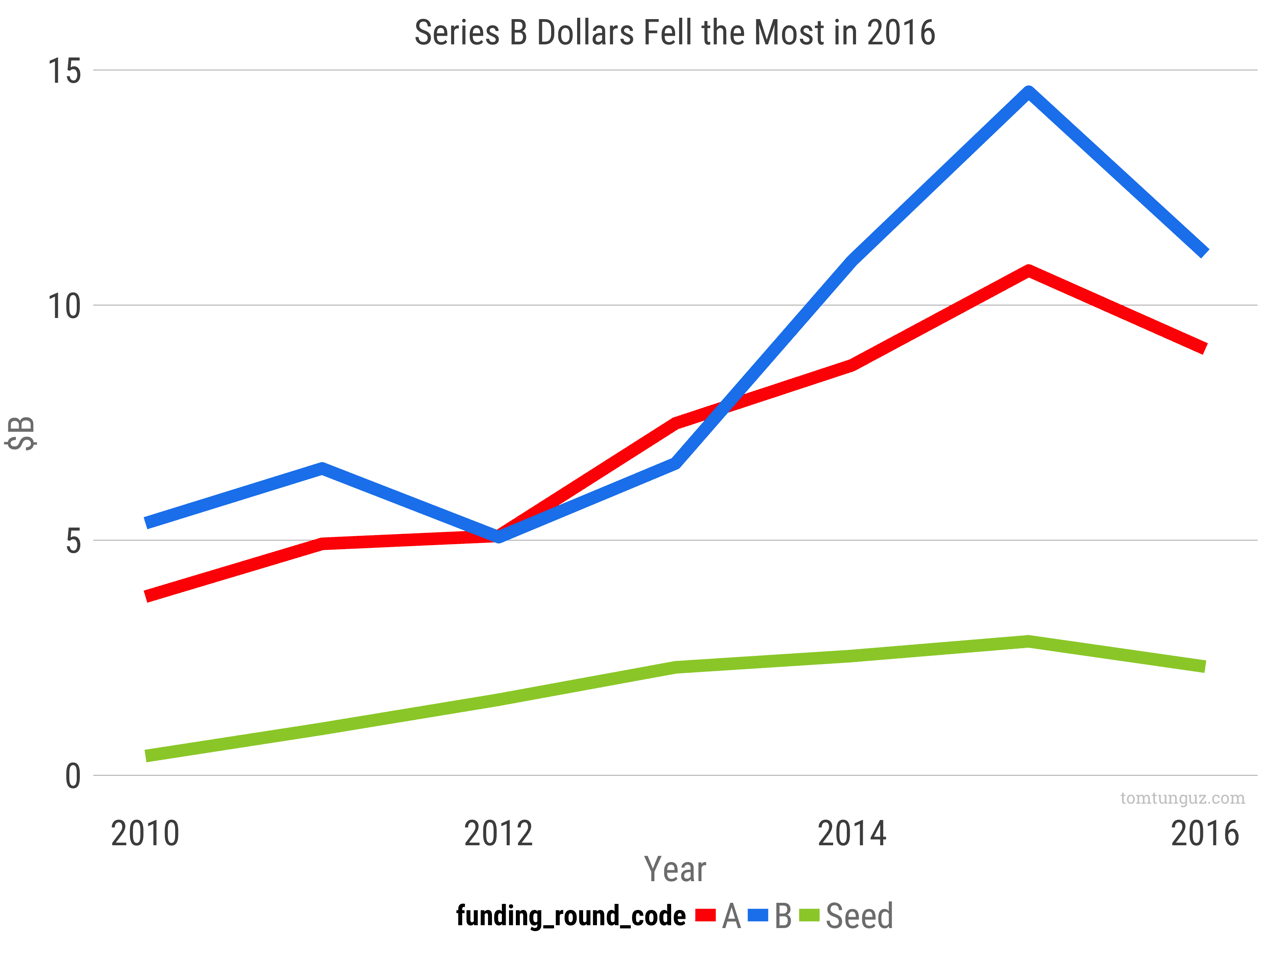
If we examine total dollars invested in each round, Series Bs reached nearly $15 billion in 2015. Notably, series B dollars have roughly equalled Series A dollars until the 2014-2015 bull market. The data suggests a reversion to the mean after a period when Series B dollars exceeded Series A by 30%.
This data suggests Series Bs may become harder to raise on a relative basis than other rounds. The aggregate amount flowing in the stage is falling the most in gross dollar terms and relative to Series As. Let’s see how the ratio of Series B to Series A dollars has changed over time.
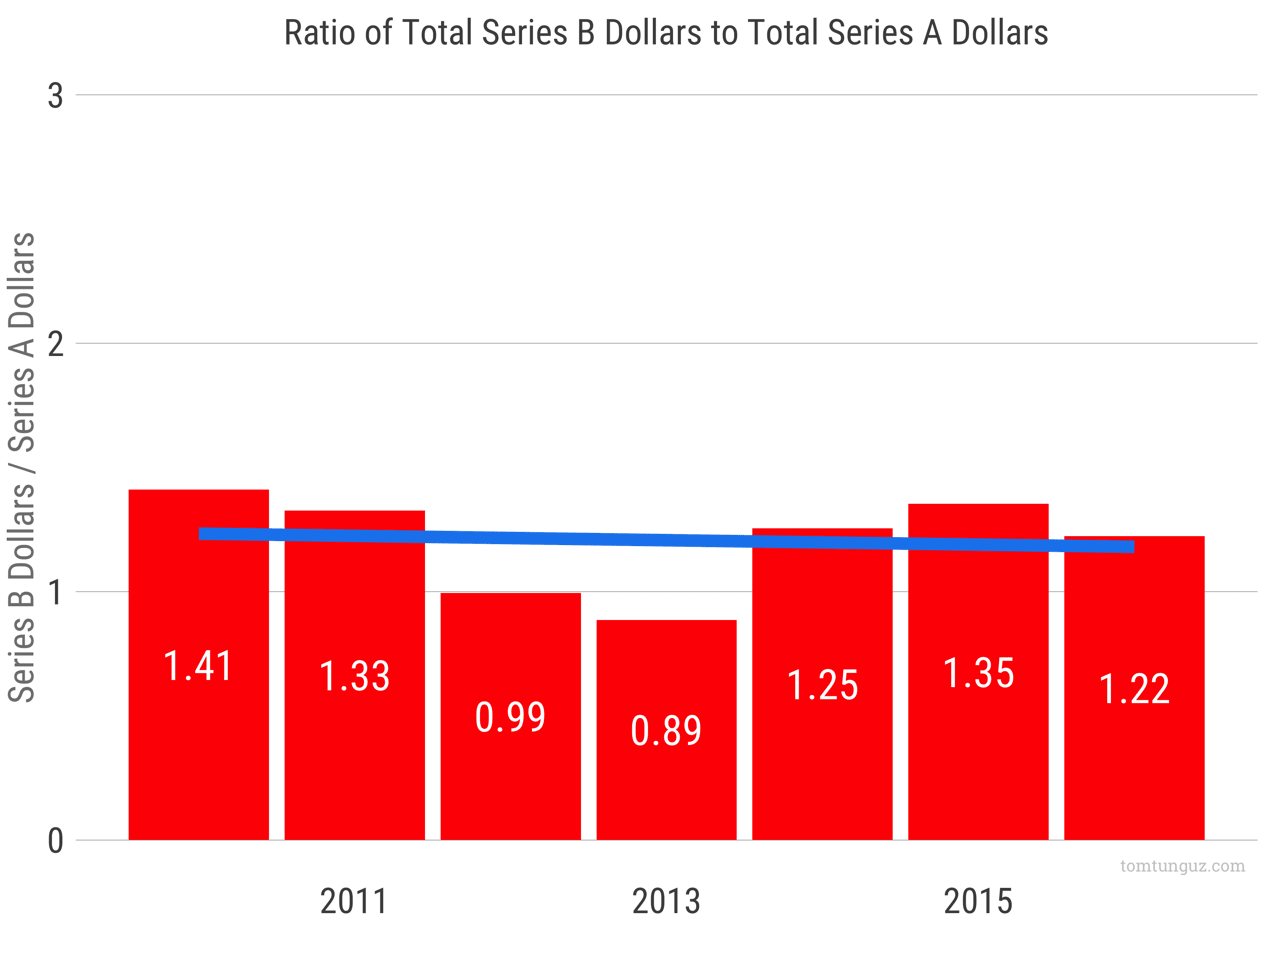
In 2010, there were 1.4 Series B dollars for every 1 Series A dollar. That coverage ratio declined through 2013 when the ratio touched 0.88. In 2016, the ratio is 1.22. Not a seven year low by a long stretch. So, there does seem to be plenty of Series B dollars for all the Series A startups who will be in market this year.
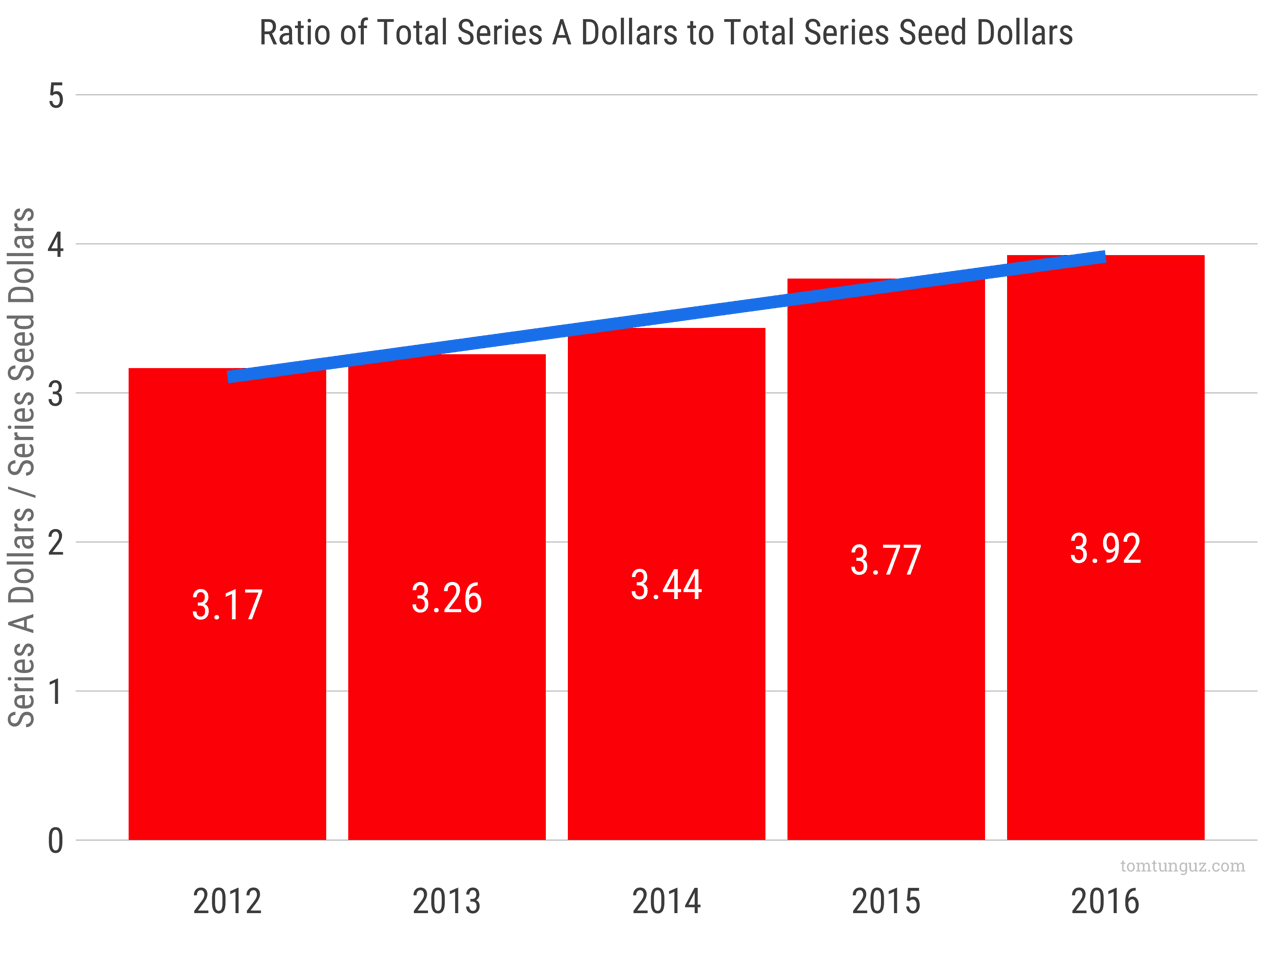
If we run the same analysis for Series A and Seed rounds, we observe a different phenomenon. Relative to Seed investments, the amount of Series A dollars available has increased steadily by about 4% per year from 2012 through 2016.
So, which is the hardest round to raise in 2017? One argument is the seed round, because the number of rounds has seen the greatest decline and the 18% y/y drop in investment in 2016 is a sharp correction.
However, the data suggests the harder rounds will be the Series B. The aggregate amount of financing is falling the most gross dollar terms (23% from its highs), and the coverage ratio of Series A dollars is declining. In addition, as Series A round size continue their steady growth, the expectations of Series B companies will increase in lockstep.
2017 isn’t the hardest Series B market of the 2010s. That distinction belongs to 2013 and 2012. Despair not, despite the vacillations of the market there’s near record-levels of capital out there to finance startups. Even if 2017 is a bit off the highs of 2014 and 2015.