6 minute read / Sep 30, 2014 /
Benchmarking MobileIron's S-1 - How 7 Key SaaS Metrics Stack Up
This post is part of a continuing series evaluating the S-1s of publicly traded SaaS companies in order to better understand the core business and build a library of benchmarks that might be useful to founders.
Founded in 2007, MobileIron is a leader in the Mobile Device Management sector. MDM provides enterprises software to manage the mobile phones and tablets of their employees. MobileIron provides three different products: a server product called Core to define and deploy security policies, a client product named Client that enforces these policies on each device and a gateway called Sentry that secures traffic from the device to the enterprise’s servers.
MobileIron employs a hybrid delivery model. The company delivers its product both as perpetual license software and as-a-Service. We will explore the differences in these delivery models and the implications for the business. MobileIron went public on Jun 12, 2014 with $100M in revenue and more than 6,000 customers.
In the next seven or so charts, we’ll explore how MobileIron built their business using data from their S-1. We will explore revenue growth, average revenue per customer, sales efficiency, payback periods, net income, gross margin and engineering spending. In these plots, I’ve used MobileIron colors as a consistent legend. MobileIron company data is brick red, median values are black, and other company values from a basket of about 40 publicly traded SaaS companies are gray.
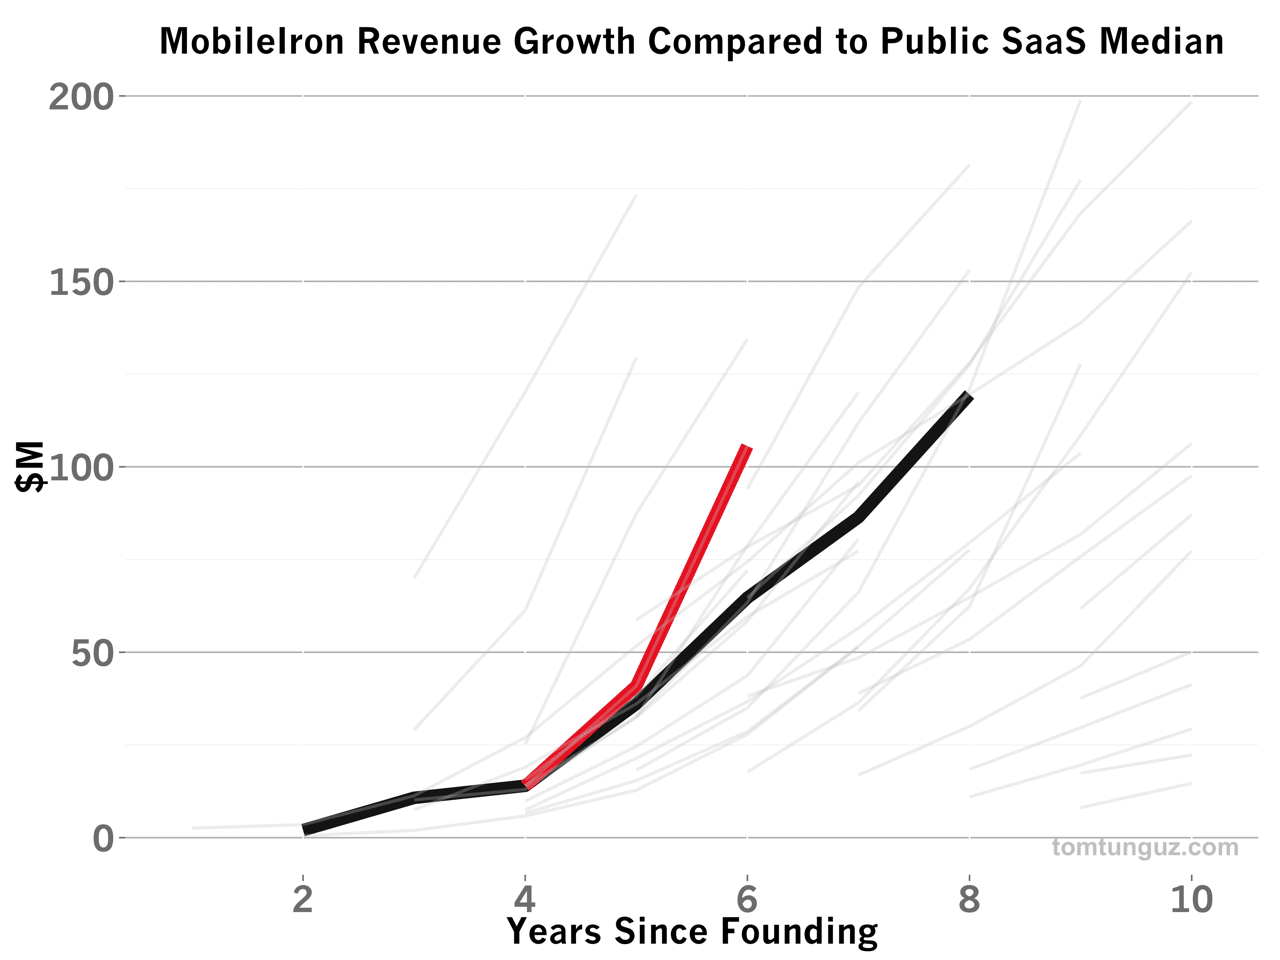
MobileIron recorded $105M in trailing twelve months’ revenue up from $13.8M just two years before. The company has grown faster than the median SaaS business in our benchmark data set, recording a 176% CAGR over this three year period compared. The median company grew by 115% from years 4 to 6 from founding.
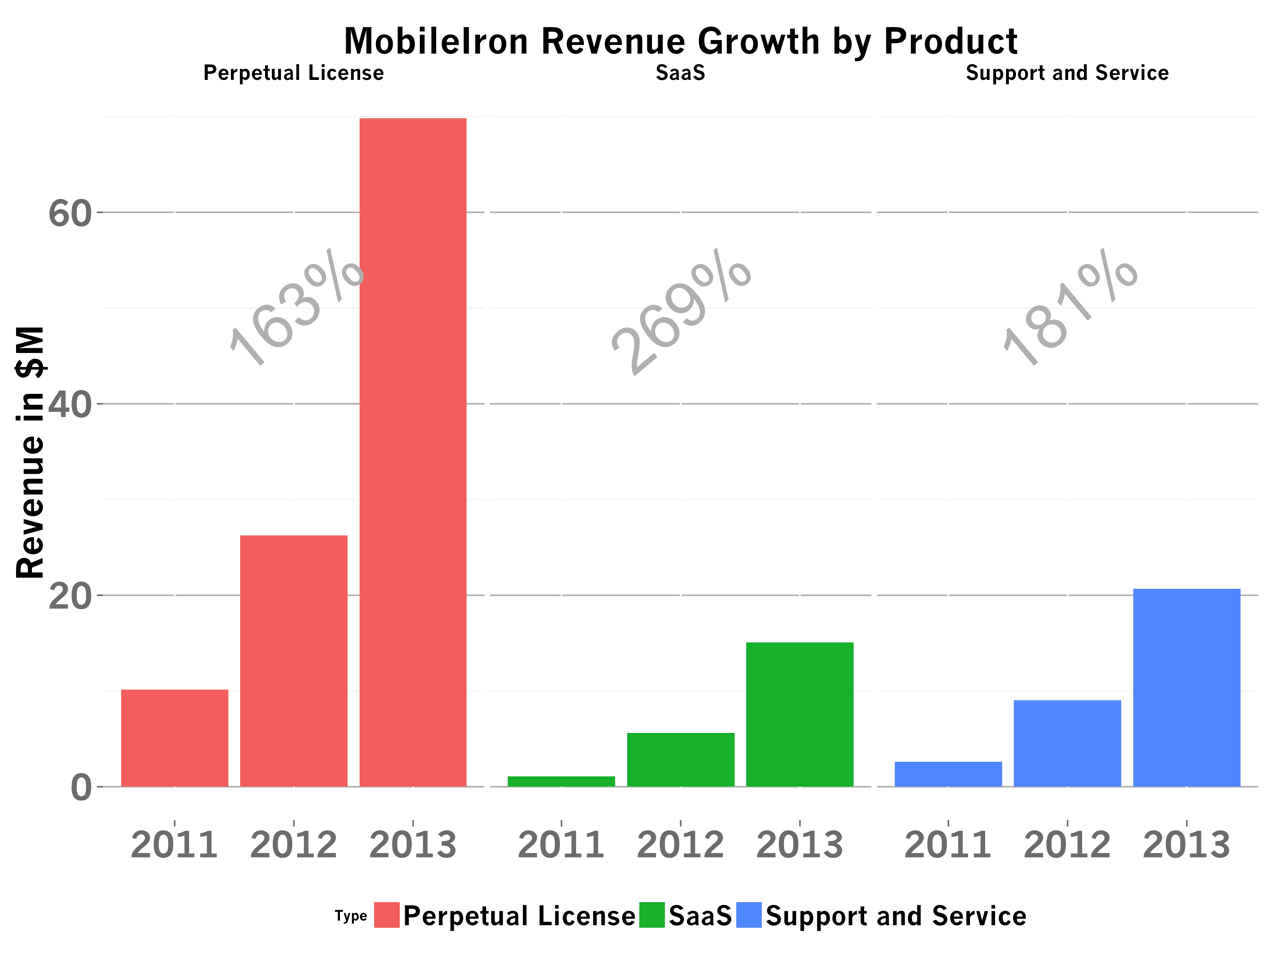
As I mentioned above, MobileIron is a hybrid business combining both perpetual license and SaaS models. The chart above shows the revenue contribution by product: Perpetual License, SaaS and Services & Support. In large gray numbers, I’ve marked the CAGR for these three years.
Two trends surface from the data. First, all lines of business are growing very well and faster than the median SaaS company. Second, Perpetual Licenses form the bulk of the company’s business. Third, the SaaS product has been growing the fastest on an annualized basis over the past three years.
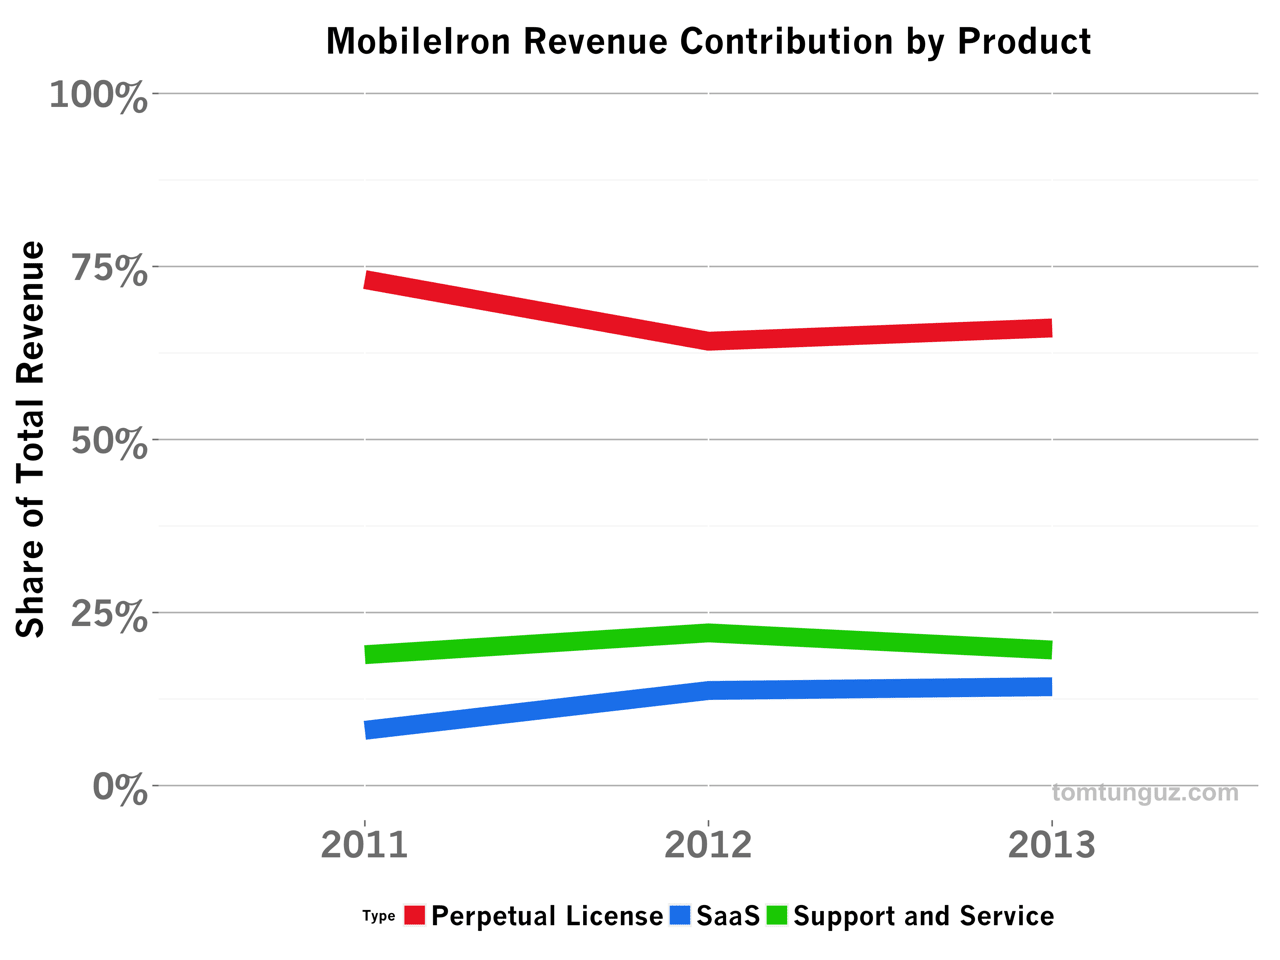
Let’s cut the data in a different way and evaluate the share of revenue contribution by product. The Perpetual License, in red, accounts for 66% of revenues, a fraction that has remained constant over the past two years. Service & Support, in green, generates about 20% of revenues, but the share is falling. And SaaS, in blue, accounts for 13-14% of revenues and is increasing slightly. In short, MobileIron still is primarily a software licensing plus support revenue model, with a SaaS product added to service a small fraction of the customer revenue base.
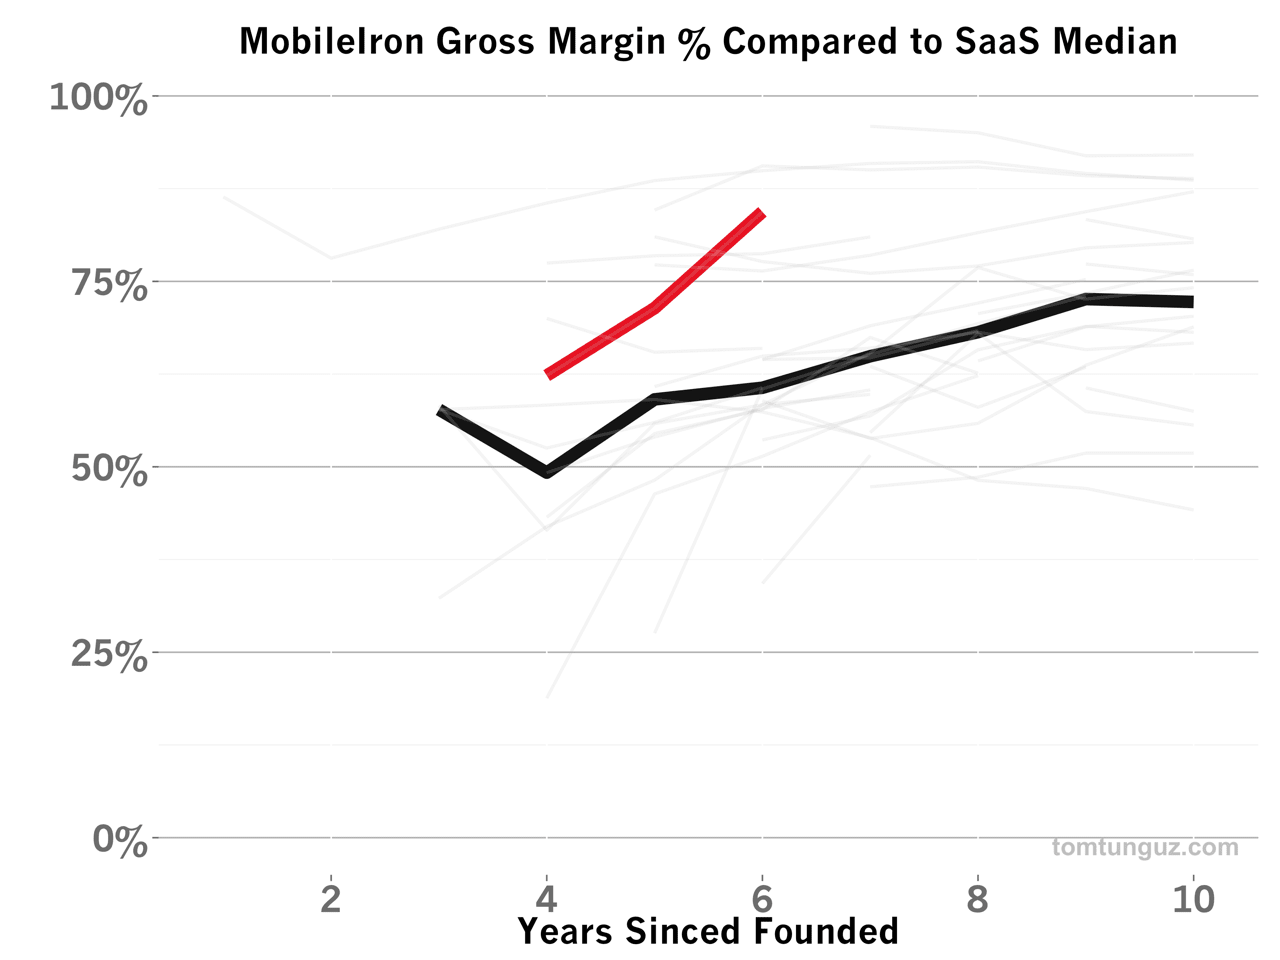
Which of these products is the most attractive for Mobile Iron to sell? First, let’s review MobileIron’s overall gross margin which has increased from 62% to 84% in the past three years, easily surpassing the median of 49% to 60%. As the business has scaled, MobileIron’s gross margin is increasing by 16% per year, a dramatic climb.
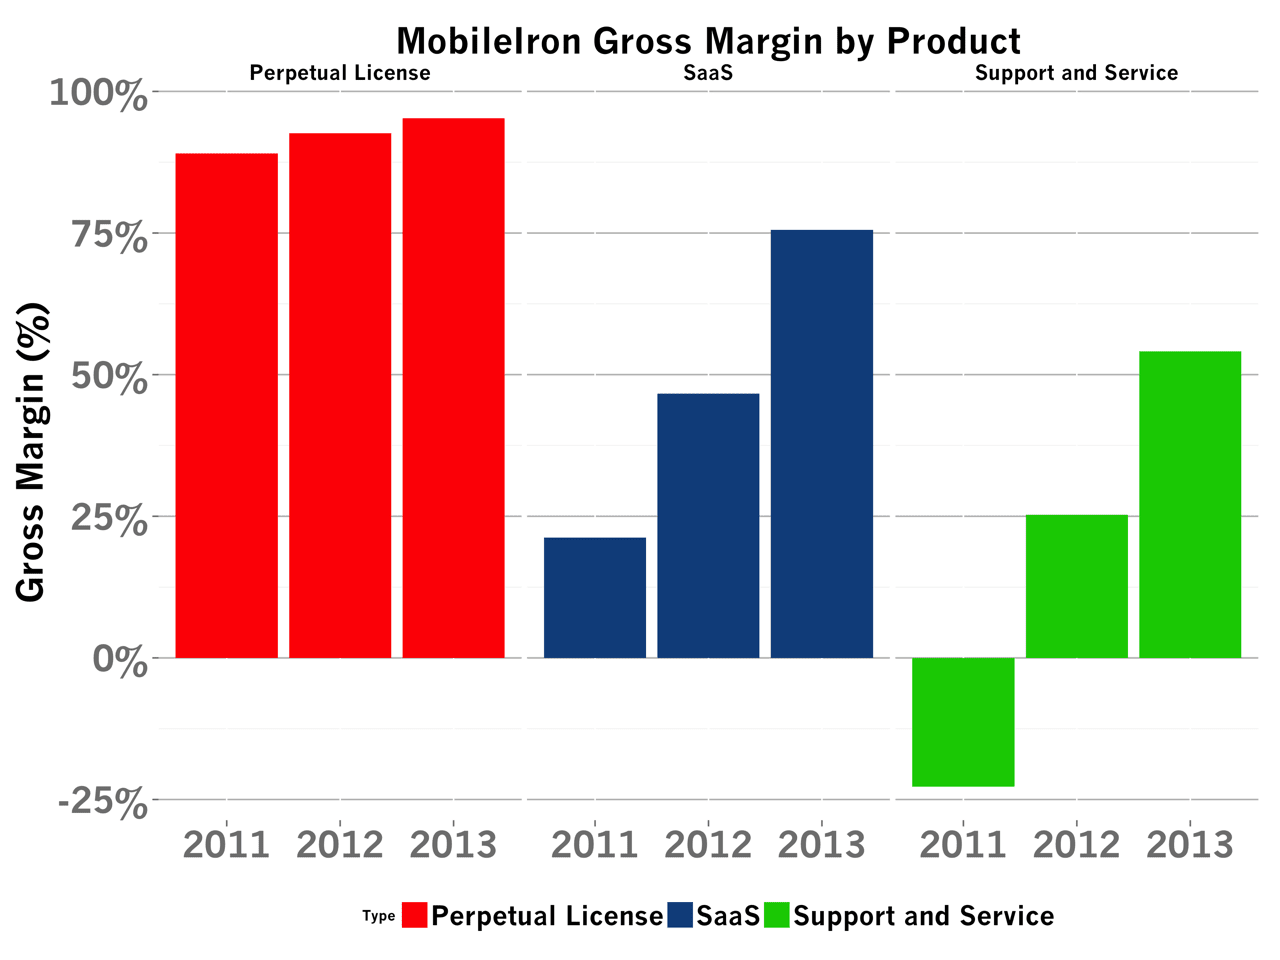
This increase in gross margin is driven by all three products, as the chart above shows. I’ve plotted the gross margin by product, over time. The Perpetual License product, as we saw in the Tableau S-1 analysis, has very high (95%+) gross margin because the cost of the revenue is small. Customers buy the software and deploy it on their own hardware, so there are no ongoing costs of revenue. In addition, I suspect nearly all customers buy Support & Service, alongside their Perpetual License product, so the account management and customer support costs are borne by the customer.
It’s interesting to note that Support and Service operated at a negative gross margin in 2011, meaning the business was losing money for each dollar of services they sold. This could be for many different reasons. The sales team may have decided to do this in order to increase sales velocity, mitigate complexity in the set-up of the product, or perhaps this team was overstaffed relative to the business coming in. It’s difficult to know for sure.
The SaaS business’ gross margins have improved dramatically over the past three years, more than tripling. This is likely because the infrastructure costs (servers, hosting, bandwidth, operations teams) required to operate the SaaS product are being amortized over a growing customer base. MobileIron runs their SaaS operation at about 76% gross margin, which is substantially better than the median SaaS gross margin of 61%, in year six.
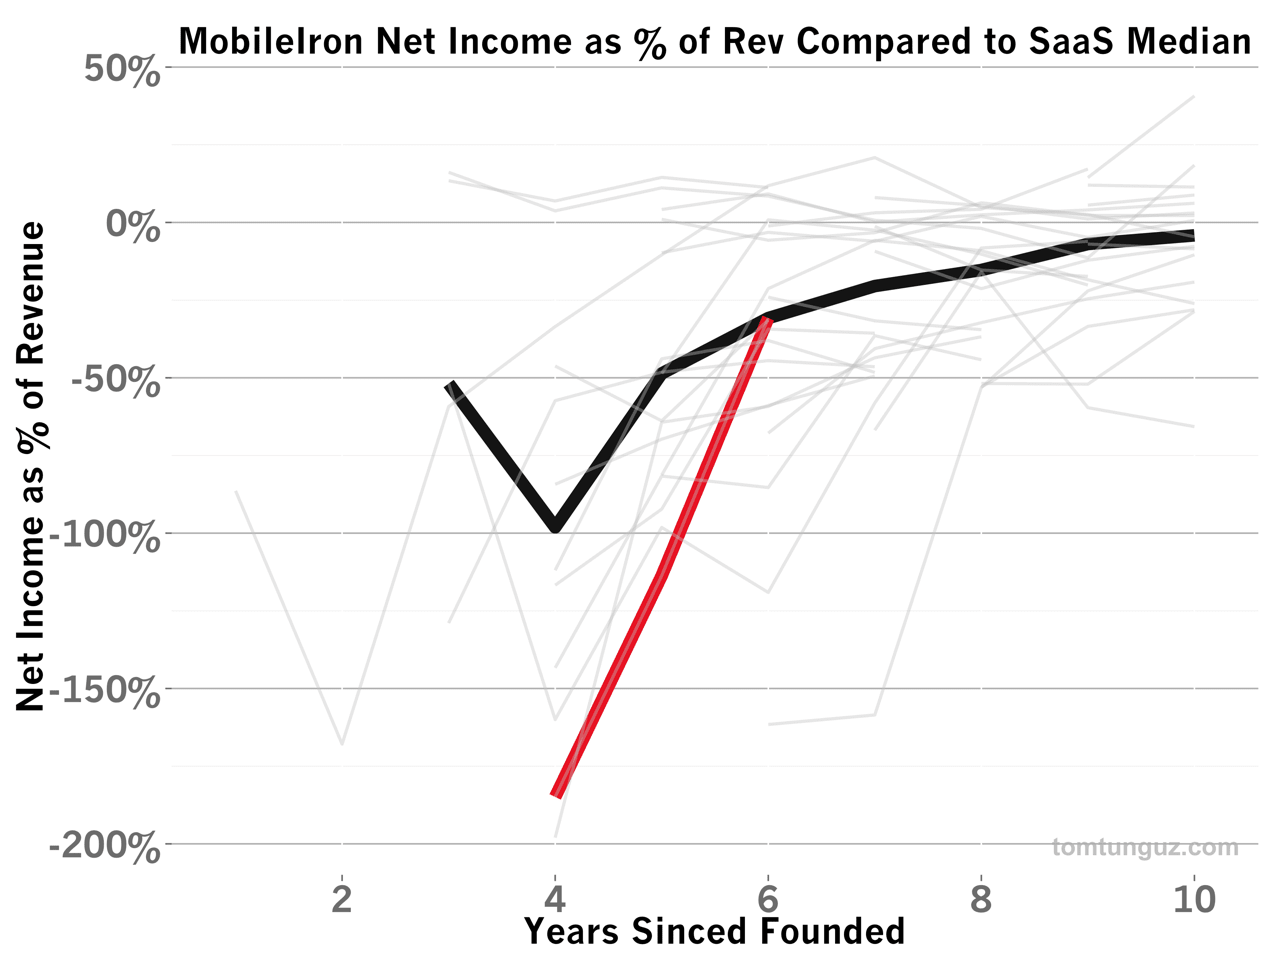
Compared to the benchmark set, MobileIron has historically burned more cash and operated at greater negative income than the median. But in the last two years, the company has made great strides towards profitability and reduced its Net Income as a % of Revenue from -184% to -31%. This reduction in burn has accompanied an amazing revenue growth.
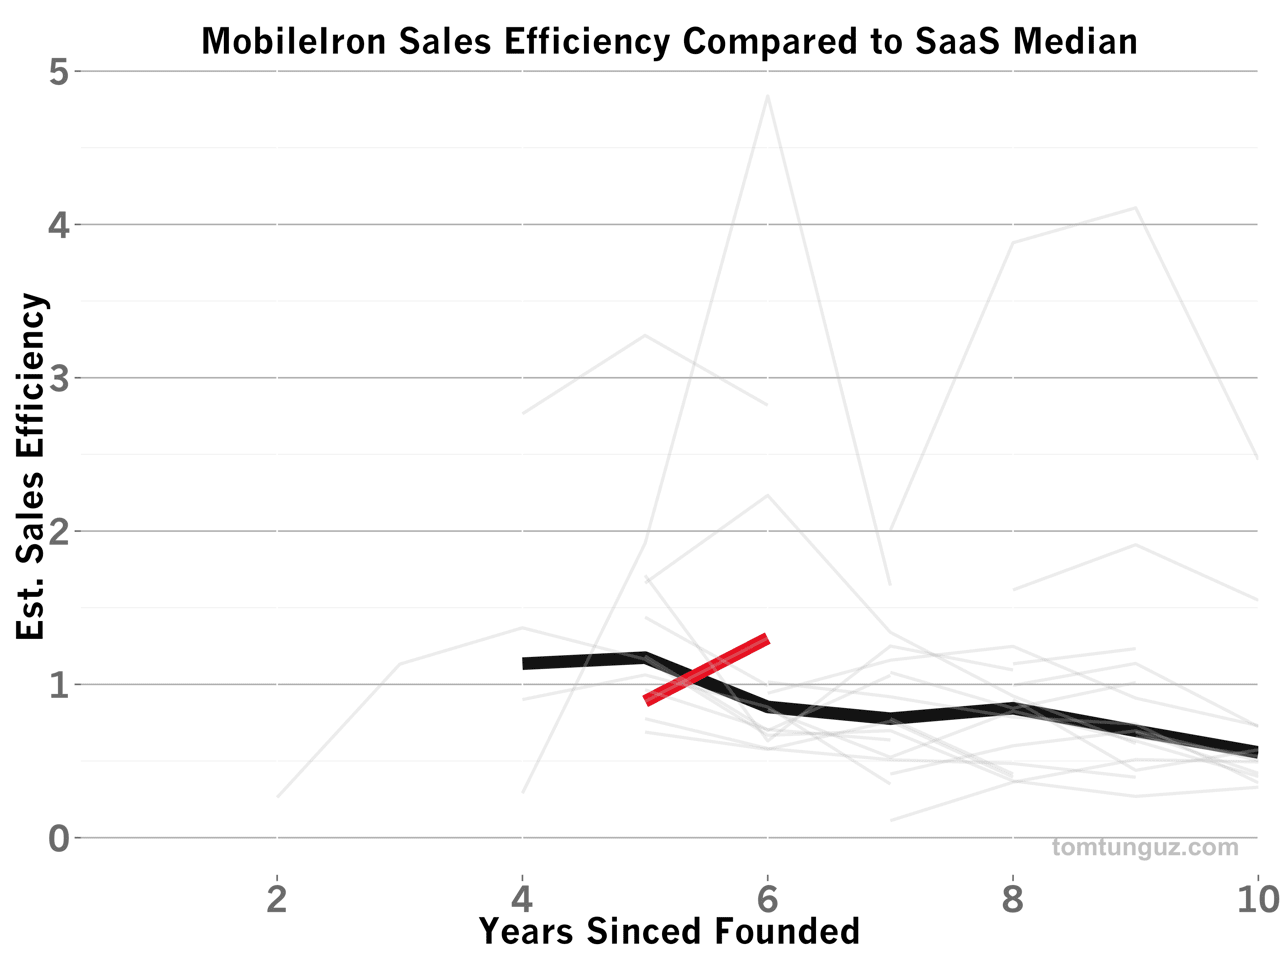
MobileIron’s sales efficiency is on the rise. The business now exceeds a sales efficiency of 1.3, meaning one dollar invested in sales and marketing returns $1.30 in revenue in the next year.
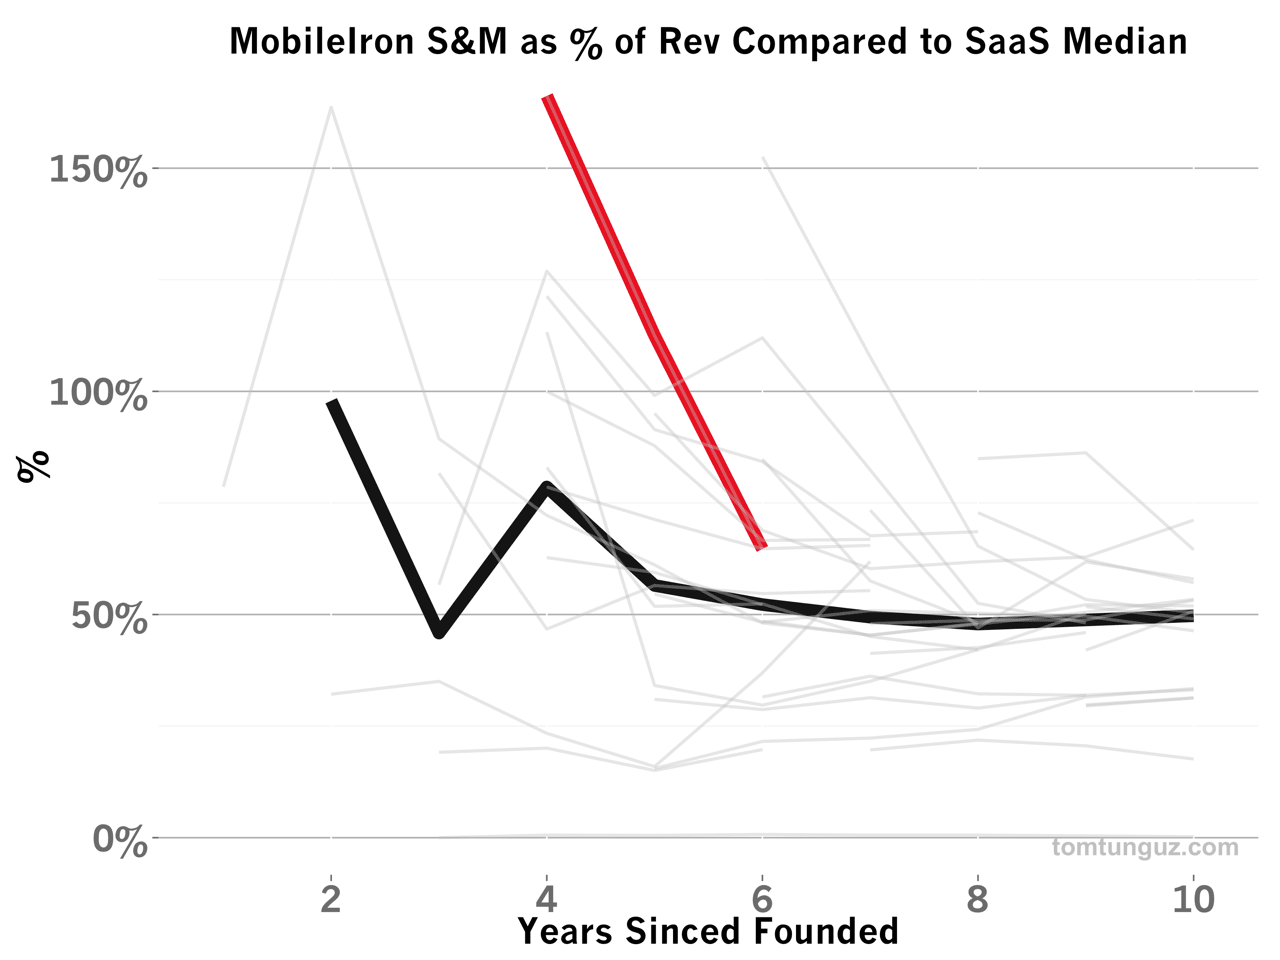
Given this terrific sales efficiency, it stands to reason the company would invest significantly in growth and the Sales and Marketing Spend as a % of Revenue. MobileIron spent the most of any company in the benchmark set as a percentage of revenue in year 4 at 166% of revenue. But over the past few years, the company has been approaching the median rapidly.
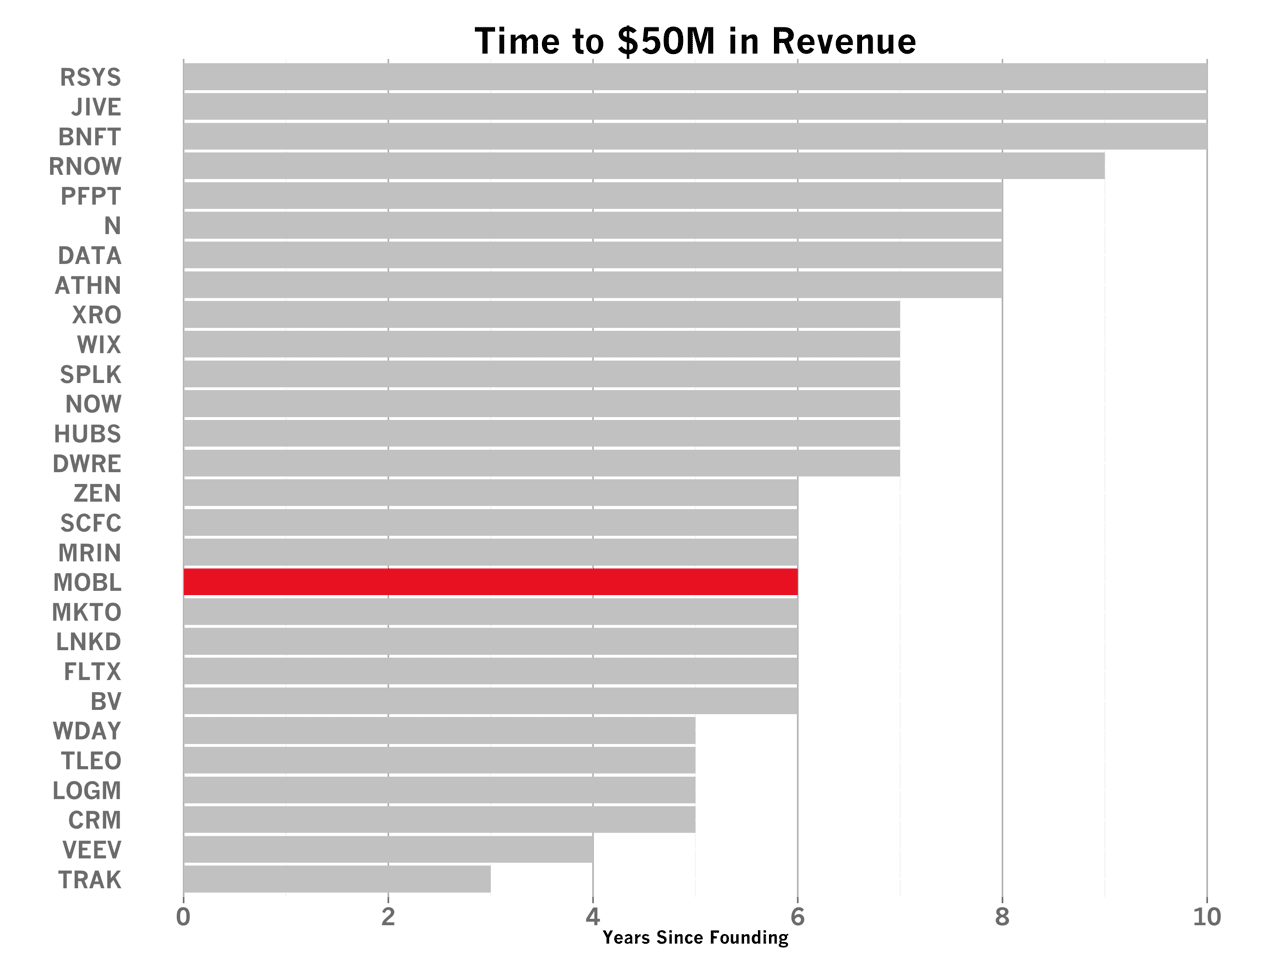
As a product of great sales efficiency and heavy sales investment, MobileIron has reached $50M in revenue among the top 10 fastest companies.
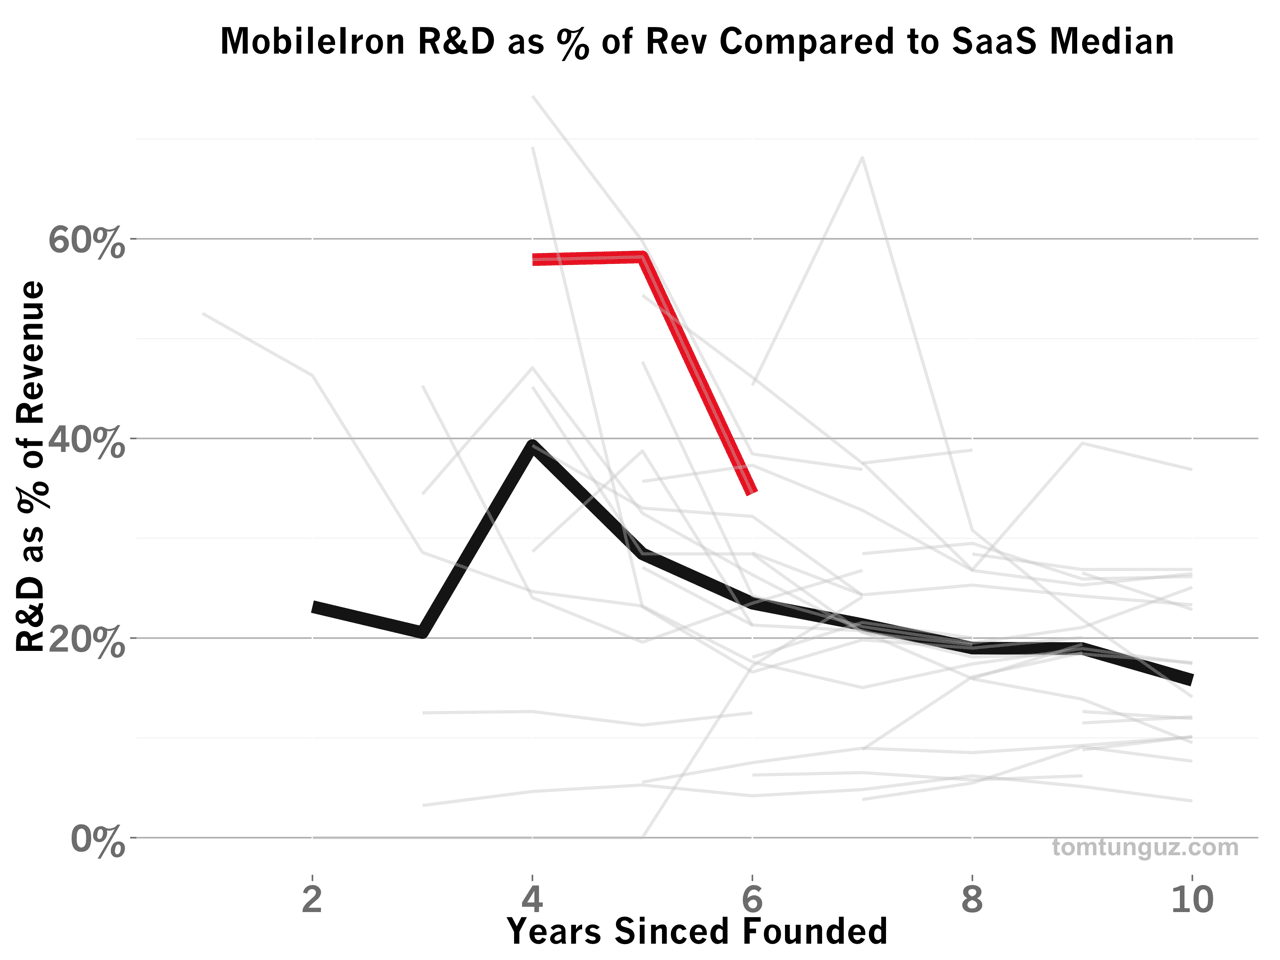
Interestingly, MobileIron’s R&D spend is significantly above the median. In years 4 and 5, the company spent close to sixty percent of its revenue, the third most of any company in the benchmark set. In year six (2013), that ratio has fallen, but still remains ten percentage points above the six year median of 23%. I’m not sure why this is. It could have to do with the volume of integrations required by such a centralized piece of software.
Or the increasing competition in the market place may have also driven heavier investment to differentiate the product. Or it might be something else.
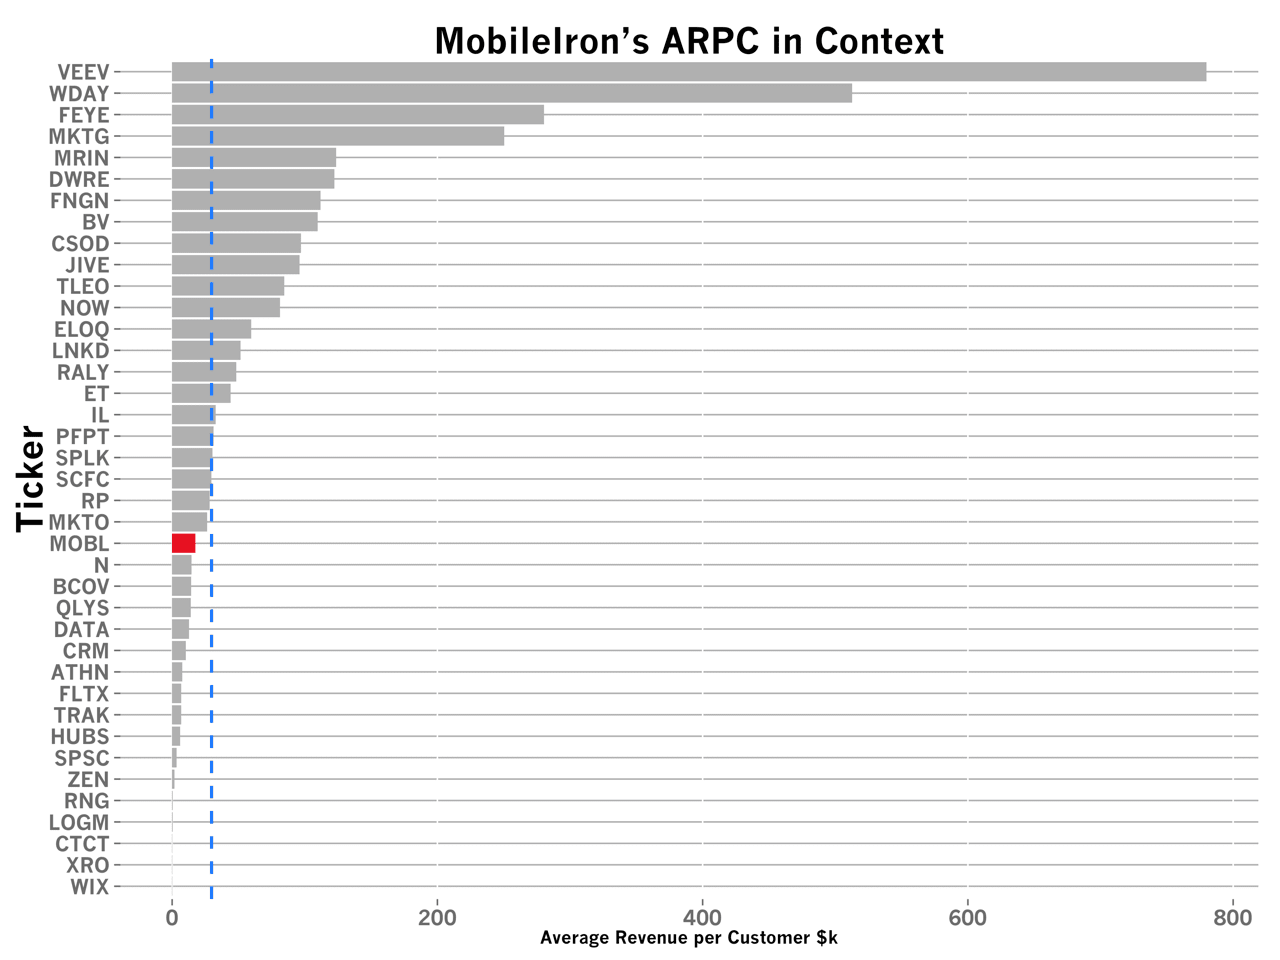
MobileIron has been able to accomplish this phenomenal revenue growth with an average revenue per customer (ARPC) of about $17,600, a price point which comfortably supports an inside sales model.
MobileIron is an impressive business with terrific revenue growth and is a good example of a hybrid Perpetual License and SaaS business.