3 minute read / Jul 23, 2014 /
The Coming Wave of Venture Capital and What It Means for Your Startup
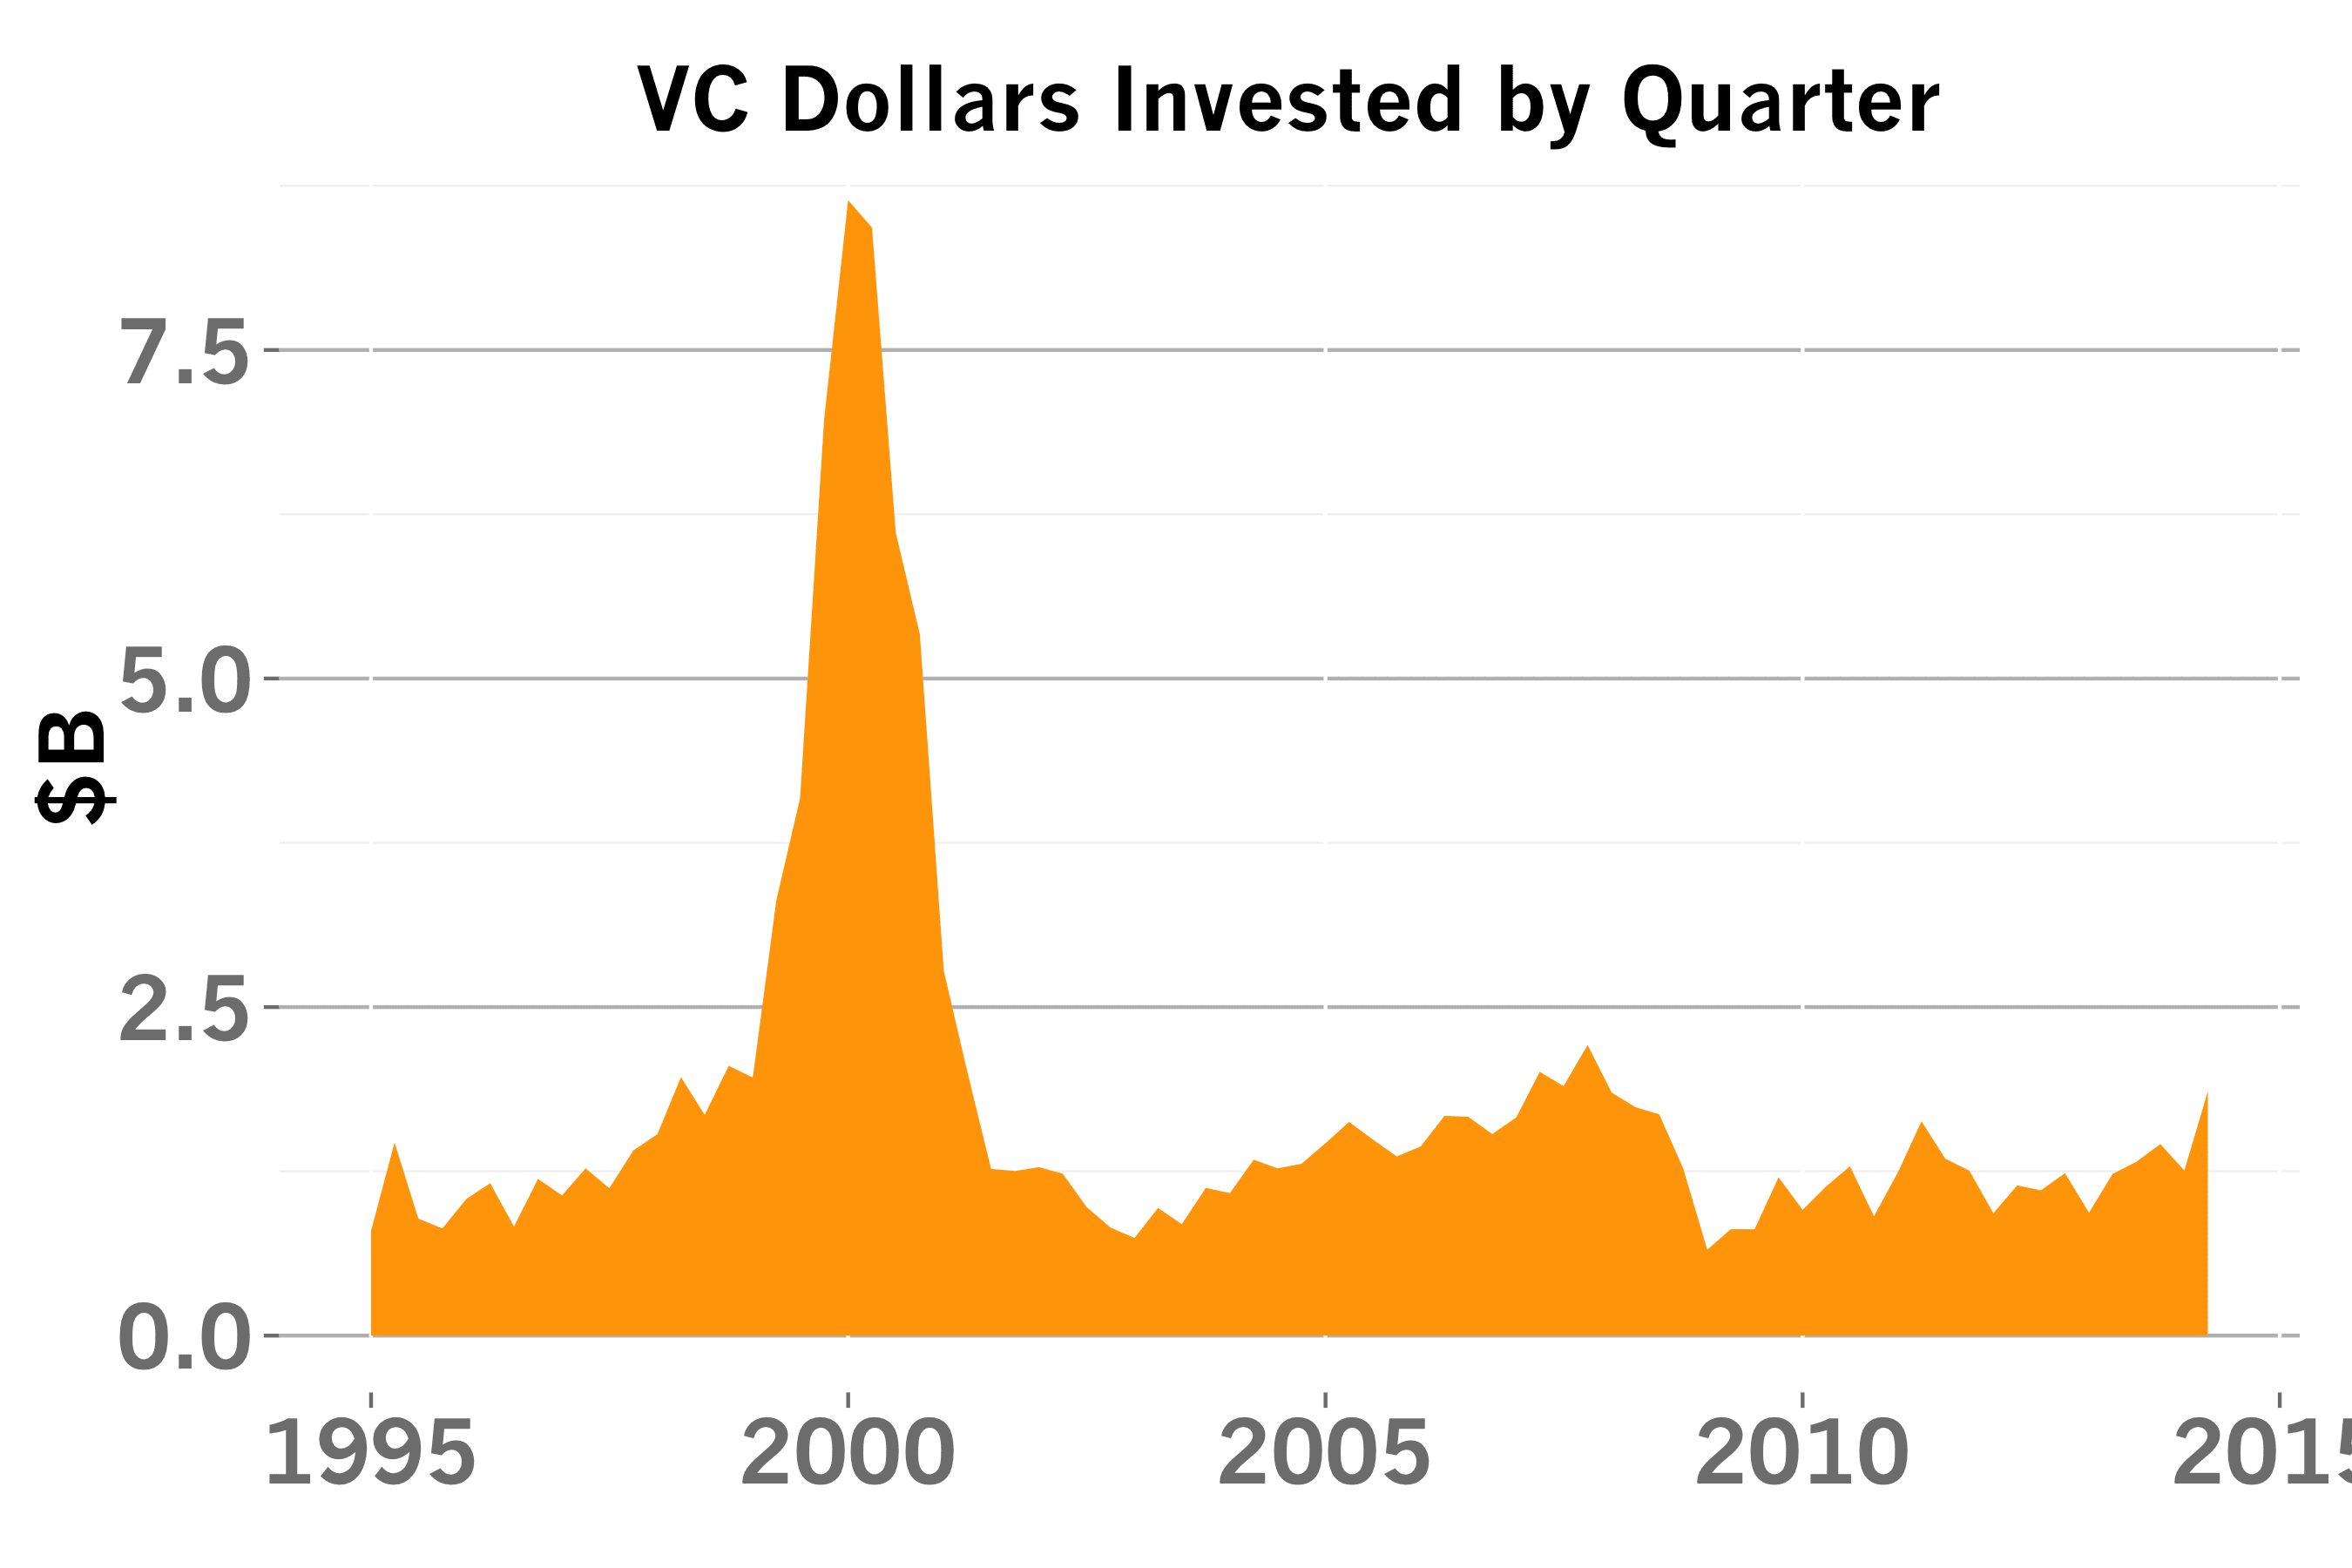
Through the first six months of 2014, VCs have raised about as much as all of 2013. If this pace of fund raising continues, 2014 would mark the biggest year for VCs since 2001, when the industry raised about $38B. This new money hasn’t yet hit the startup fundraising market in earnest, as the chart above shows. The second quarter of 2014 is the sixteenth largest by capital deployed sinced 1995, making it a top quartile quarter, but to break into the top five, that figure would need to triple.
Nevertheless, we will see a spike in the next six months as firms begin investing from new funds. Which startup sectors should expect to benefit from this surfeit of capital?
Each quarter, the National Venture Capital Association and Thomson Reuters gather data on the VC industry. I’ve used this data to draw the long term investment trends across the US venture capital industry. The chart above depicts the VC sector investment trends within this data and compares the share of VC dollars raised by entrepreneurs in particular sectors each quarter.
Consumer startups have been raising between 15-20% of dollars for the past few years and that share seems to be on the rise. But make no mistake; software investments are the real story. VCs have doubled their allocations to software compared to five years ago. This shift to software has been at the expense of Infrastructure investments which saw their heyday in the 2000 era when the nervous system of the internet was built and scaled. Health startups have garnered a persistent share of about 20% of dollars. Meanwhile, Energy investment has collapsed, plagued by capital intensive projects with very long success horizons.
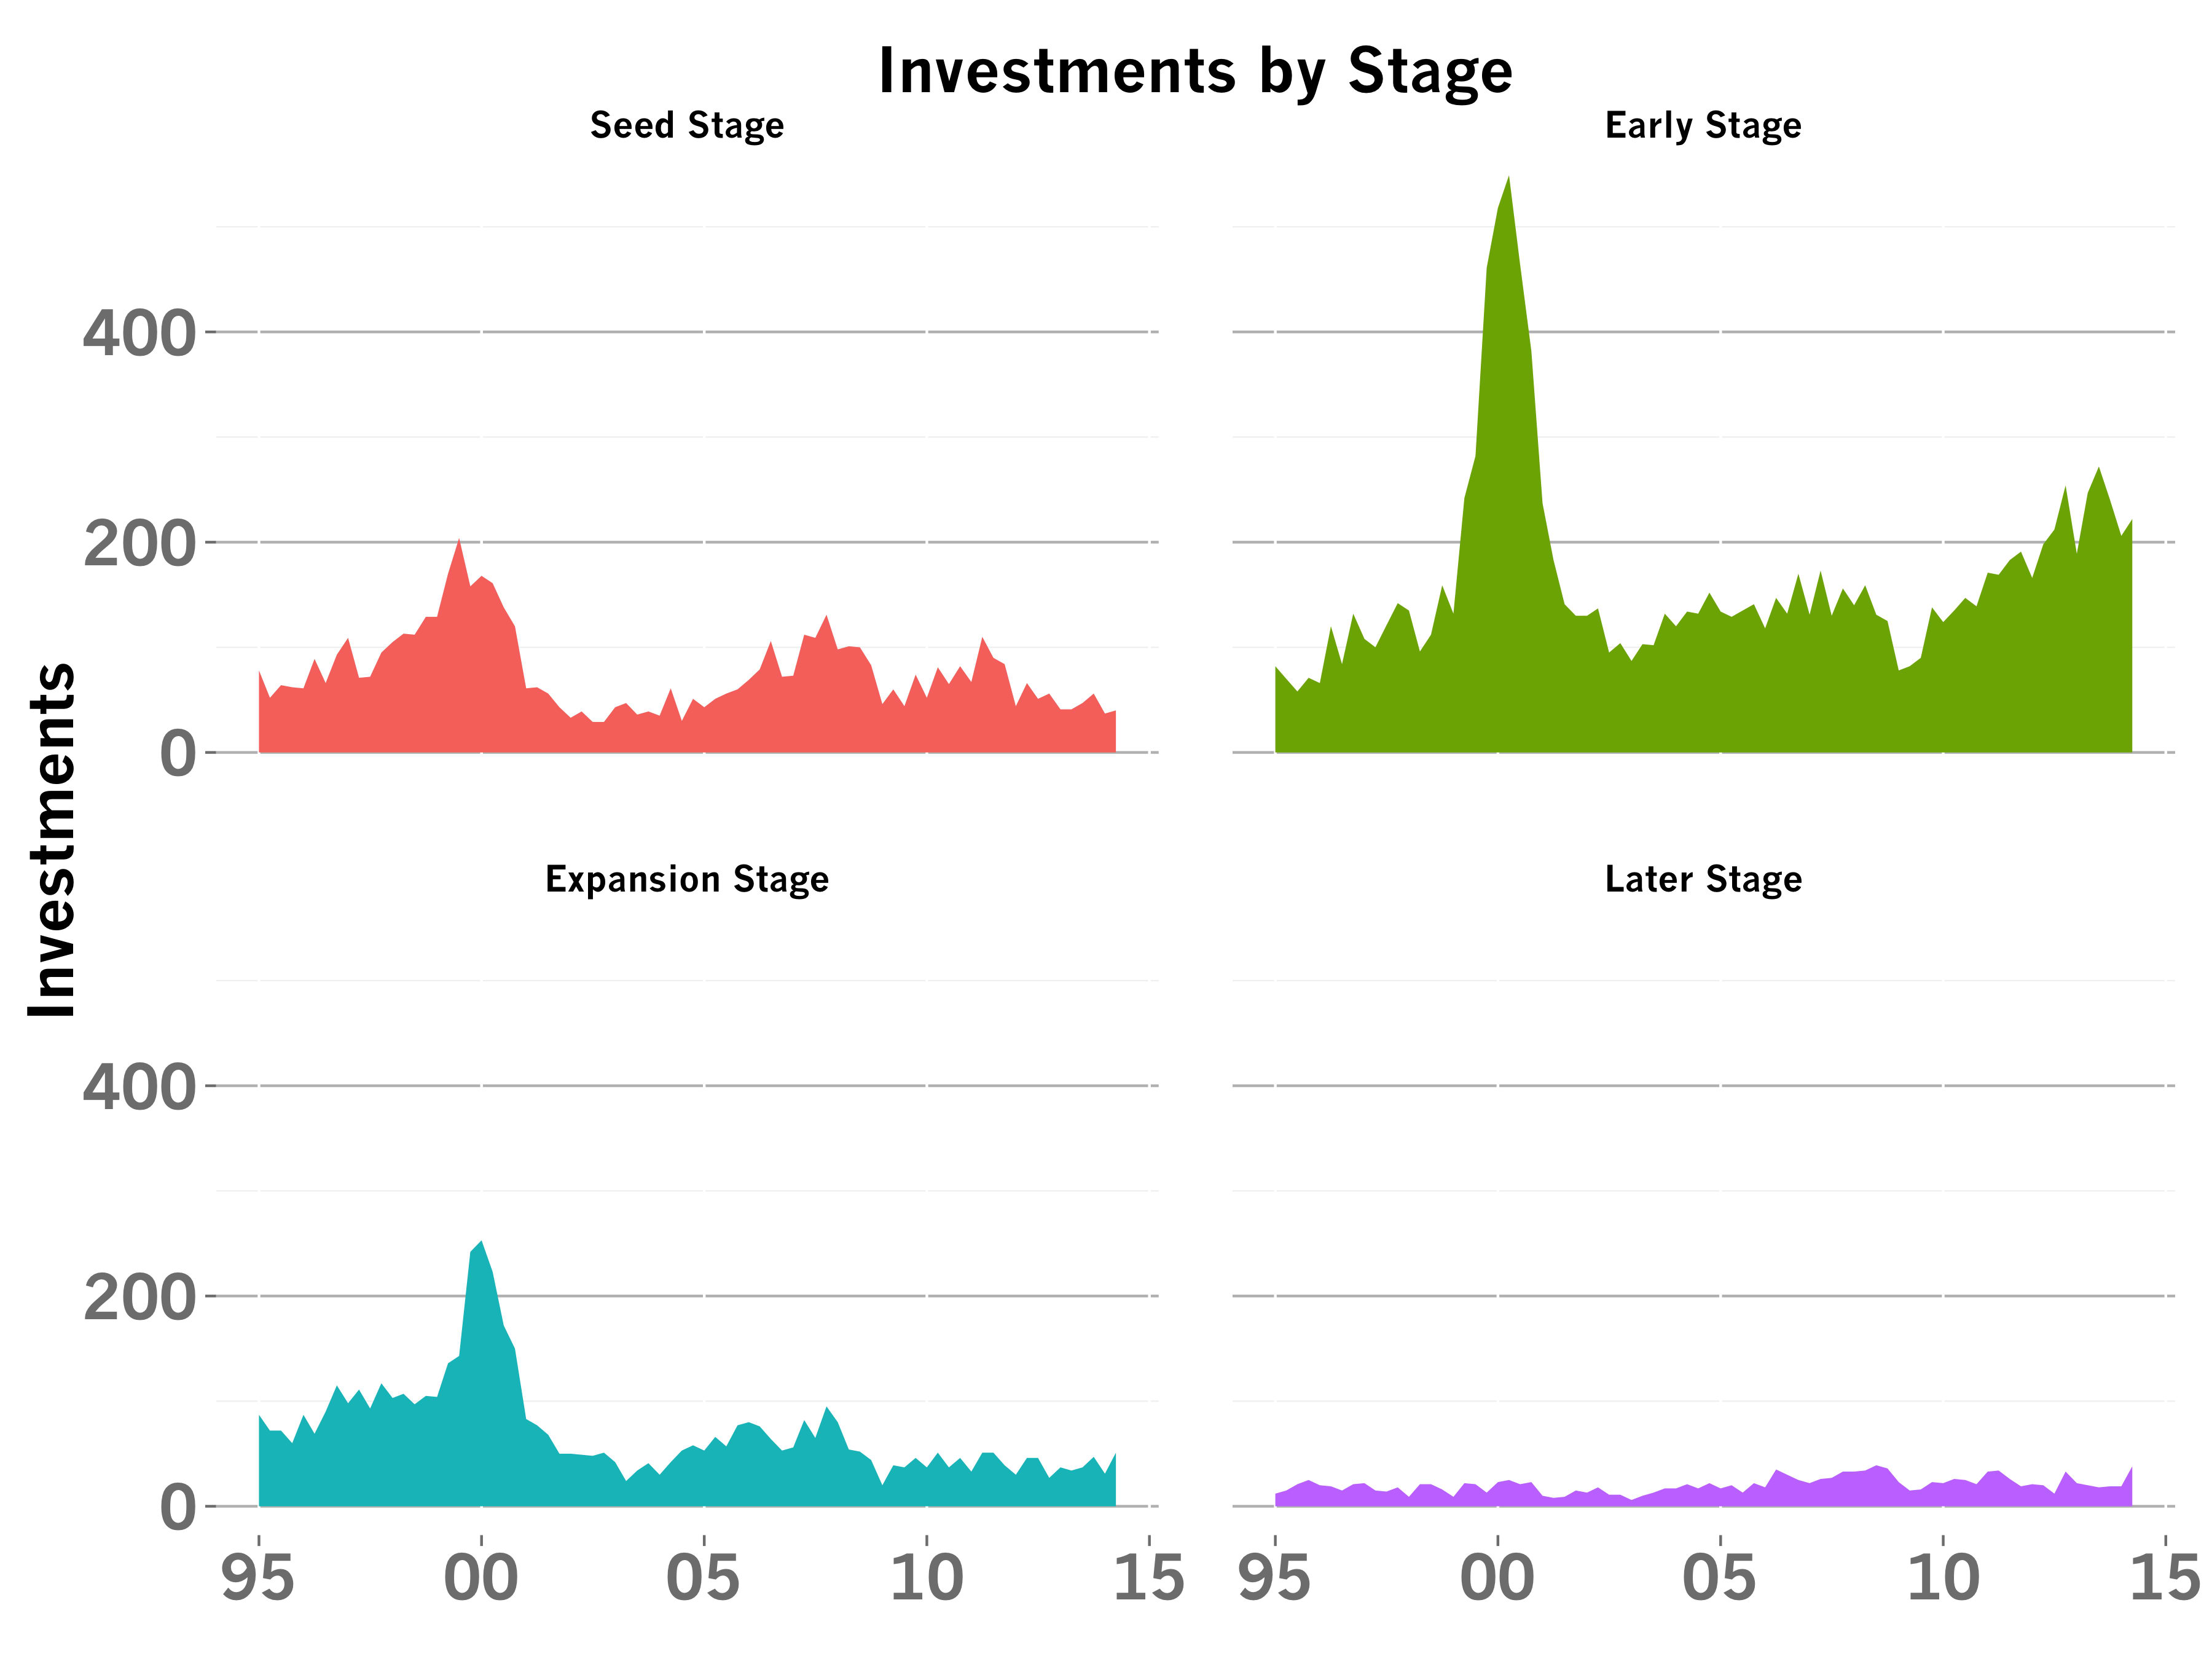
Which rounds should become easier to raise? The NVCA’s data on share of investment dollars by stage is plotted above. Keep in mind, the total number of investments has remained relatively constant at roughly 350 per quarter over the past few years. In that relatively calm environment, there has been a marked shift to Early Stage/Series As investments on a dollars and number basis, at the expense of Expansion Stage/Series Bs. Later Stage/Growth Investments seem to be relatively constant.
It’s hard to predict whether the doubling of dollars into VC bank account will translate into a consistent pattern of investment both by stage. Some of the funds raised may be dedicated to a particular stage for example, and will skew the results in the future.
But if past trends are any indication and with twice the capital entering the market in 2014, the market for early stage software and consumer investments should be quite strong over the next 12-18 months, provided the public market remains steady.